Recap
In our last article titled “Charter Q4’23 Earnings: Net Broadband Losses, Robust Mobile Net Adds, 8% FCF Yield,” we highlighted that internet broadband net adds had been under pressure due to low market activity and heightened competition from Fixed Wireless Access (“FWA”) operators and fiber overbuilders. However, one of the FWA operators suggested that net adds below its quarterly trend were still sufficient to reach its 2025 target. Moreover, fiber overbuilders revised their fiber deployment targets given lower-than-expected returns. On the other hand, we estimated Charter (NASDAQ:CHTR) had retained most of its mobile subscribers following the promotional roll-off late last year. Lastly, we believe the stock selloff was overdone.
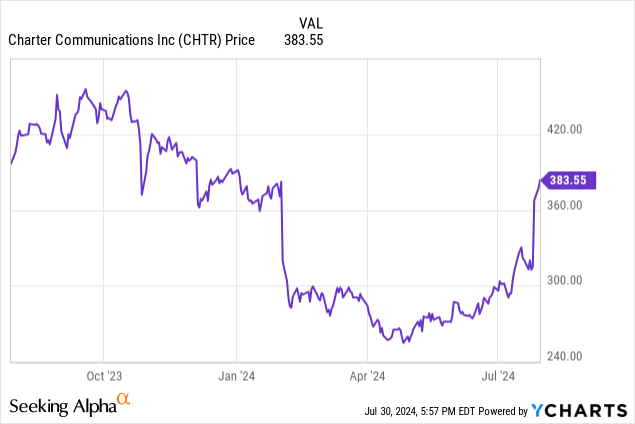
Since we reiterated our BUY rating, the stock price has increased by 33%, far outperforming the S&P 500 which advanced by 9%. The sudden jump was primarily because of lower-than-anticipated internet broadband net losses in 2Q24: 149,000 net loss (actual) vs. 306,000 net loss (consensus). The 2Q24 results also led analysts to revise their earnings forecast upward.
In this article, we will discuss about the 2Q24 earnings results and how our thesis remains unchanged.
2Q24 Earnings Results
Please find the summary of the 2Q24 earnings results below:
2Q24 Earnings Results (Company, Vektor Research)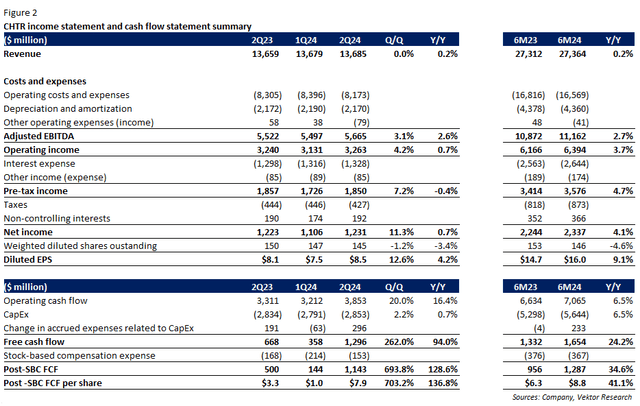
In 2Q24, revenue was roughly flat sequentially and on a year-on-year basis, including a $30 million one-time headwind from the Affordable Connectivity Program (“ACP”)-related items.
Revenue from internet broadband was flat sequentially but increased by 1% (Y/Y). Charter reported 149,000 broadband net losses during the quarter, higher than the net losses in 1Q24 at 72,000. According to management, of these 100,000 impacted by non-pay ACP disconnects, about 50,000 came from voluntary churn, while the remaining ones were due to reduced gross additions. Additionally, cable companies are still facing a low move activity environment and competition from FWA operators and fiber overbuilders.
Broadband net adds (thousand) (Company)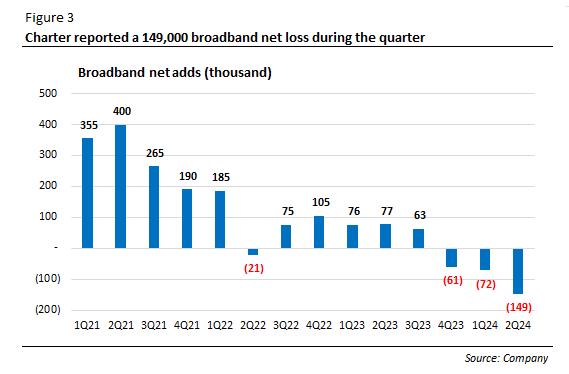
Video’s revenue continued its sequential decline (-1% Q/Q) and retreated by 8% (Y/Y), with net losses standing at 408,000, the second consecutive quarter above 400,000. On the other hand, mobile net adds came strongly at 557,000, also driven by a free line promotion for former ACP subsidy recipients. Mobile revenue was up nearly 8% sequentially. During the quarter, Charter launched several initiatives, including Anytime Upgrade and a phone balance buyout program that allows customers to switch with the remaining balance on ported lines paid off up to $2,500.
Mobile ARPU was driven by upgrades to the Unlimited Plus plan priced at $40 per month and the Spectrum One promotional roll-off. ARPU would have been 2.7% if the ACP impact and stand-alone mobile revenue allocation had not been considered.
Moving on to the cost side, programming costs declined 4% (Q/Q) and nearly 10% (Y/Y) primarily due to a shrinking video customer base. Other cost of revenues was up by 6% (Q/Q) as a result of higher mobile direct costs and mobile device sales. Cost-to-service declined by 5% sequentially, given lower labor costs and bad debt expenses.
Adjusted EBITDA grew 3% sequentially despite management’s estimate of a tepid growth last quarter. Margin came in at 41% vs. 40% in 1Q24, driven by a decline in the video segment that generates lower margins than the internet segment, Spectrum One promotional roll-off, and political advertising revenue.
Adjusted EBITDA and margin (Company)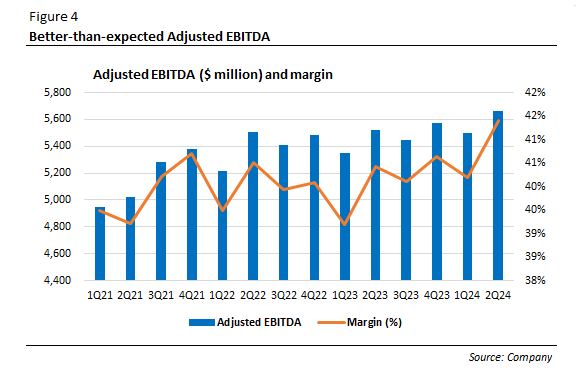
Post share-based compensation free cash flow was $1.1 billion, up from $500 million last year, driven by lower cash taxes and favorable working capital. Management said that besides working capital timing, the company has been improving how it manages its balance sheet:
On that front, we’ve been managing the balance sheet to provide us better overall cash flow and increased flexibility. Over the last several quarters, we sold our towers portfolio, which generated almost $400 million in proceeds. We launched our EIP securitization program in the second quarter, which backs a new $1.25 billion credit facility at favorable interest rates. And we’ve been working with our vendor base to extend our payment terms, utilizing a supply chain financing tool to support our working capital favorability.
During the quarter, the company repurchased 1.5 million shares at an average of $271 per share for $404 million. Net debt to adjusted EBITDA was 4.32x, down from 4.41x in 1Q24, as management seeks to lower that number closer to the mid-point of the 4-4.5x target. Going forward, management anticipates the full-year Capex to be at $12 billion, down from the $12.2-$12.4 billion range, due to higher broadband and video net losses including lower CPE costs.
What Concerned the Market
We have read some concerns about Charter, including:
1. Declining core business because of the heightened competition, leading to depressed valuations.
2. A questionable past capital allocation strategy and whether Charter will remain committed to its leverage target.
Peaking FWA growth and more rational overbuilders
Our thesis remains unchanged in that Charter will report broadband net adds as FWA growth peaks. Indeed, Deloitte found that most of FWA subscribers were switchers from DSL and cable. Additionally, according to Opensignal, 74% of FWA subscribers spent less than $75 per month, compared to just 60% of Cable subscribers. Thus, cost was a key factor in switching to FWA services.
However, another study by Opensignal shows that Charter’s Spectrum led against the big three mobile network operators in download speed, consistent quality, and video experience. Please note that this study includes all technologies deployed by the ISPs in question, including DSL and fiber. T-Mobile (NASDAQ:TMUS) and AT&T (NYSE:T) underperformed in those categories, since T-Mobile relies completely on FWA, while a third of AT&T’s customer base came from non-fiber. So, we can conclude that Cable has no glaring problems with the broadband performance, and they have been losing customers mostly due to lower-priced FWA and its ubiquitous coverage.
There is light at the end of the tunnel, as FWA operators have not yet revised their subscriber number targets. Moreover, T-Mobile management said that ~400,000 quarterly net adds are all it needs to reach its target, down from 550,000 customers quarterly. Verizon (NYSE:VZ) recently deployed its C-band spectrum in the suburban and rural areas. However, management did not update its 4-5 million subscribers target on the 2Q24 earnings call. Markets have been concerned about the capacity available for FWA services in the long run.
FWA operators’ net adds (Companies)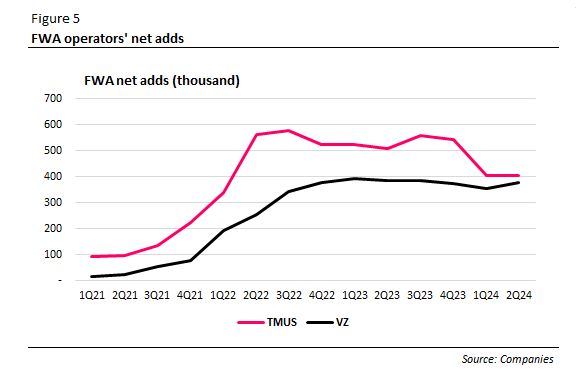
On the other hand, fiber overbuilders have been rationalizing their expansion strategy as inflation, permit process, financing difficulties, and higher labor costs have led to lower-than-expected returns. We are of the view that once Charter begins upgrading its existing hybrid-coaxial network, and that FWA growth peaks, it will start growing its internet broadband customer base.
Spending billions to buy back shares while adding debt, but now the stock yields 9%…
In total, Charter has been spending $73 billion on stock buybacks, reducing over 50% of diluted shares outstanding. Nevertheless, questions have been asked about the rationale behind Charter’s aggressive stock buybacks even when the stock price was at peak. For instance, the company spent $4 billion buying back shares at an average $753 per share in 3Q21. These repurchases have historically been funded by free cash flow and debt.
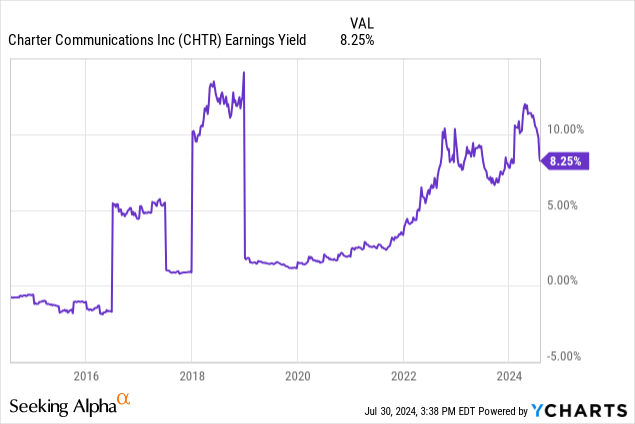
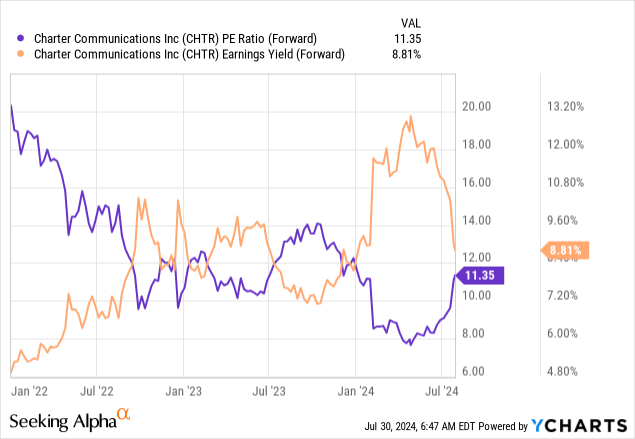
In theory, if earnings yield is higher than the after-tax cost of debt, it might be a good strategy to fund share repurchases with debt. However, Charter’s cost of debt ranges from around 4.5% to 5.5%. The after-tax cost of debt is from 3.5% to 4%. So, questioning past stock buybacks, especially during the 2021 peak when the yield was below the after-tax cost of debt, is valid, in our view. However, following the massive drop in 2021, the stock has been yielding above the after-tax cost of debt.
…while remained committed to stay within its leverage target
On the 2Q21 earnings call, management said:
On share repurchase, we’ve been targeting a leverage to be at the mid to high end of our target leverage range. And so the buybacks, we think about the long-term value of Charter, and we think it’s high. And so really, when we look at buybacks, it’s more about the target leverage range target, as opposed to trying to be opportunistic for not day triggers.
Charter’s capital allocation strategy is to buy back stocks while retaining, instead of reducing, its leverage ratio target. This has been the case since 2016. However, Charter’s aggressive stock buybacks have indeed helped increase the stock price since 2016. Additionally, Charter is simultaneously repurchasing its shares and paying down its debt. Thus, as things stand, we believe that Charter remains committed to buying back stocks without exceeding its leverage target.
Charter’s net debt to EBITDA (x) (Koyfin)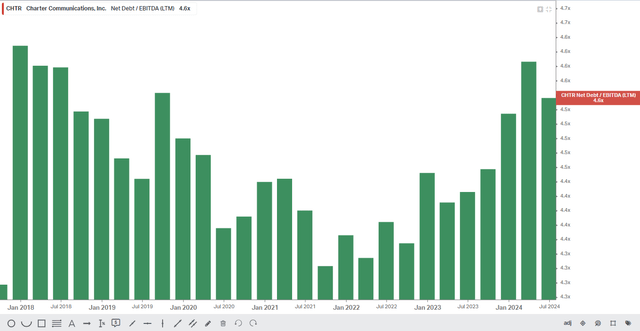
Investment Risks
The impact of ACP disconnects in the 3Q24 and 4Q24
The ACP program ended in February, but the subsidy was reduced to zero only in June. We should expect more disconnects in the third and fourth quarters this year, primarily in the third quarter. JPMorgan analysts anticipate broadband net losses of 300,000 in the 3Q24. The stock could be under pressure if net losses were higher than expected.
FWA growth does not peak after reaching the 2025 targets
Improved spectral efficiency and more base stations will result in more capacity, which could lead to sustained FWA subscriber growth post-2025.
Valuation
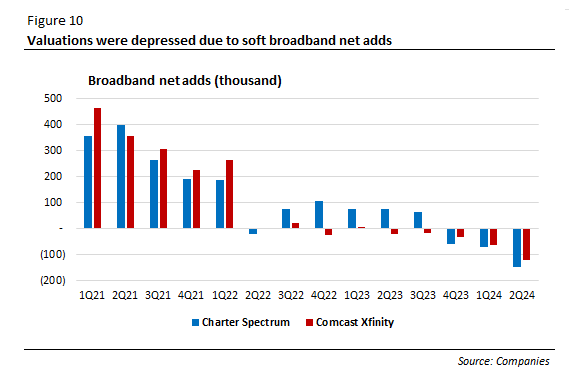
The stock is trading below the 5-year average of earnings and EBITDA multiples. Charter and Comcast (NASDAQ:CMCSA) have seen multiple contractions from the 2021 peak levels, as broadband net adds have been soft following the proliferation of FWA (see Figure 10).
Charter’s multiples (Koyfin) Broadband net adds (thousand) (Companies)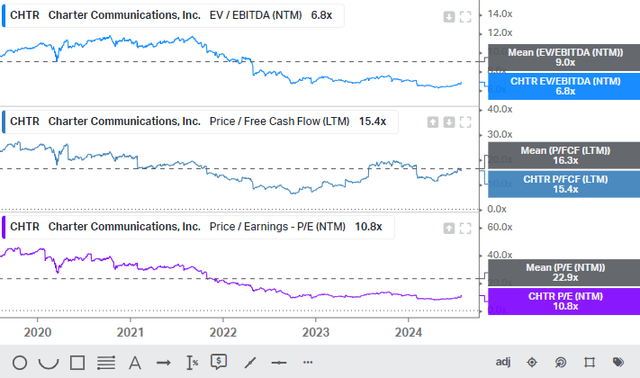
Based on our 10-year reverse DCF model with 2025 as the base year, the market is expecting only 0.7% annual revenue growth, 24% EBIT margin, and 3% FCF growth. Our assumptions include a 7% WACC and a 6x terminal EV/EBITDA multiple. We utilized revenue growth consensus estimates from Seeking Alpha.
However, if we conservatively assume a 1.5% long-term revenue growth, driven by broadband net adds and mobile revenue growth, and a 25% operating margin in the terminal year, we arrive at $482 per share (26% upside potential) by 2025F. This implies an 8x forward EV/EBITDA, still below the 5-year average of 9x. The stock catalyst is broadband net adds, in our view.
10-year reverse DCF (Vektor Research)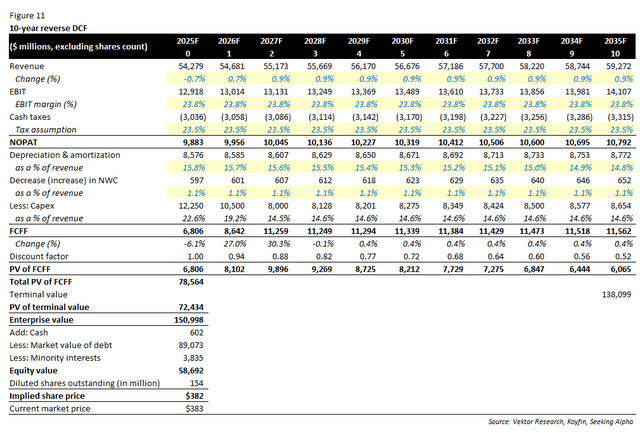
Conclusion
Lower-than-expected broadband net losses have led to a surge in the stock price. Mobile net adds came in strongly, even if we excluded a free line promotion for former ACP subsidy recipients. However, we should expect higher broadband net losses in the 3Q24 since the ACP subsidy was down to zero in June, which can put pressure on the stock price if net losses are higher than expected.
Markets are concerned about deteriorating core business, a questionable past capital allocation strategy, and whether Charter will stay committed to its leverage target. However, we believe that peaking FWA growth, more rationale fiber overbuilders, and existing network upgrades will result in broadband net adds, which will drive the stock price. In addition, Charter is buying back stocks at 9% yield vs. 4% after-tax cost of debt, while simultaneously reducing its debt levels to its mid-point target. We believe that Charter will buy back stocks while staying within its leverage target.
The market is anticipating a tepid long-term growth rate. Our conservative estimates suggest that Charter’s fair value is $482 per share by 2025F (26% upside potential). This implies an 8x forward EV/EBITDA, lower than the 5-year average of 9x. The stock catalyst is broadband net adds, in our view. What could go wrong? Besides short-term headwinds from ACP disconnects, sustained FWA growth due to improved spectral efficiency and more base stations are key investment risks.
Maintain BUY. If you have any question, please do not hesitate to comment below.
Read the full article here


