: Why I Changed My Mind Recently")
")
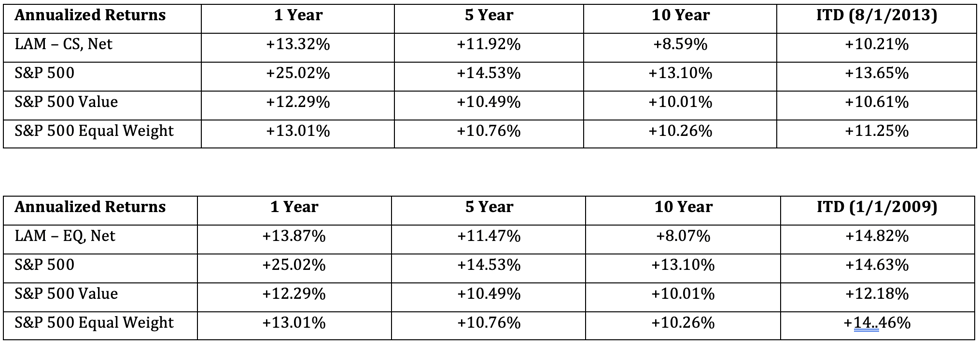
Lyrical had a respectable year in 2024 with our CS composite generating a 13.4% net return, outperforming both the 12.3% return of our style benchmark (S&P 500 Value) and the 13.0% return of the S&P 500 Equal Weight. That said, we materially underperformed the S&P 500 (SP500, SPX), which produced a 25.0% return.
As was the case in 2023, in 2024 the S&P 500 return was significantly boosted by a small number of mega-cap growth stocks. This effect was evident when comparing the returns of the S&P 500 to the S&P 500 Equal Weight. In 2023, the cap weighted index outperformed its equal weight counterpart by 12.4 percentage points, and in 2024 it outperformed by a similar 12 percentage points. These are the second and third widest differentials in a calendar year over the 35 years since the inception of the S&P Equal Weight index in 1990.
It may feel like the dominating performance of mega-cap growth stocks will go on forever, but the data lead us to expect otherwise. Historically, whenever the cap weighted index has outperformed the equal weight index by the widest margins, the following five years experienced a reversal, with the equal weight index substantially outperforming. Furthermore, in those same environments, value stocks outperformed by even more.
We believe Lyrical’s value portfolio remains attractively positioned with a historical EPS growth rate of over 9%, more than two percentage points faster than that of the S&P 500. Despite this better growth profile, our CS composite had a P/E ratio of 12.1x, while the S&P 500 P/E was 80% higher at 21.8x. This valuation spread is incredibly wide by historical standards. Given our EPS growth, we expect that spread to compress, driving outperformance in the process.
24 MONTHS OF MAGNIFICENT SEVEN
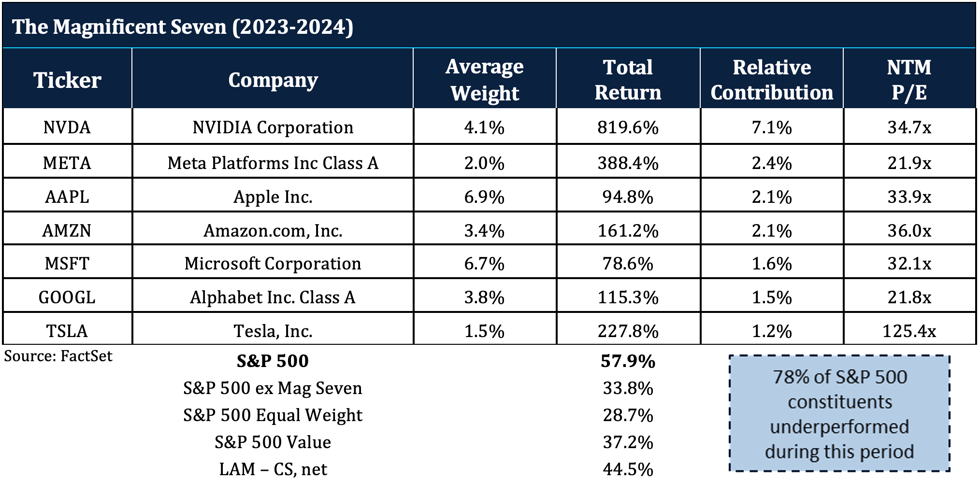
The Magnificent Seven is the popular nickname for the seven mega-cap growth stocks that drove much of the returns of the S&P 500 in 2023 and 2024. Specifically, the seven are: Nvidia (NVDA), META, Apple (AAPL), Amazon (AMZN), Microsoft (MSFT), Alphabet (GOOG,GOOGL) , and Tesla (TSLA).
Source: FactSet, Lyrical Analytics
We have not owned any of the Magnificent Seven, which makes sense given that we are disciplined value investors. As you can see from the P/Es in the table, these stocks do not fit in the value category. The priciest of the seven is Tesla at over 125x forward earnings. Four have P/Es in the 30s, and Meta and Alphabet have P/Es in the 20s. For the two years combined, the S&P 500 returned 57.9%, with the Magnificent Seven contributing 24.1 percentage points. NVDIA was the largest single contributor, adding 7.1 percentage points on its own.
Without the Magnificent Seven, the S&P 500 return would have been 33.8%, but the impact of mega-cap stocks in general extended beyond the Magnificent Seven. The S&P 500 Equal Weight return was an additional 5.1 percentage points lower at 28.7%.
The value index fared better than the Equal Weight over these two years with the S&P 500 Value returning 37.2%. Lyrical trailed the S&P 500 but outperformed the S&P 500 Equal Weight by 15.8 percentage points, and the S&P 500 Value by 7.3 percentage points.
The Magnificent Seven and other mega-cap stocks increased the S&P 500 return so much over the past two years that an incredible 78% of the S&P 500 constituents underperformed. That’s nearly four out of every five. With so many stocks underperforming, it truly has been an incredibly challenging environment for bottom-up stock picking.
WEIGHT MATTERS
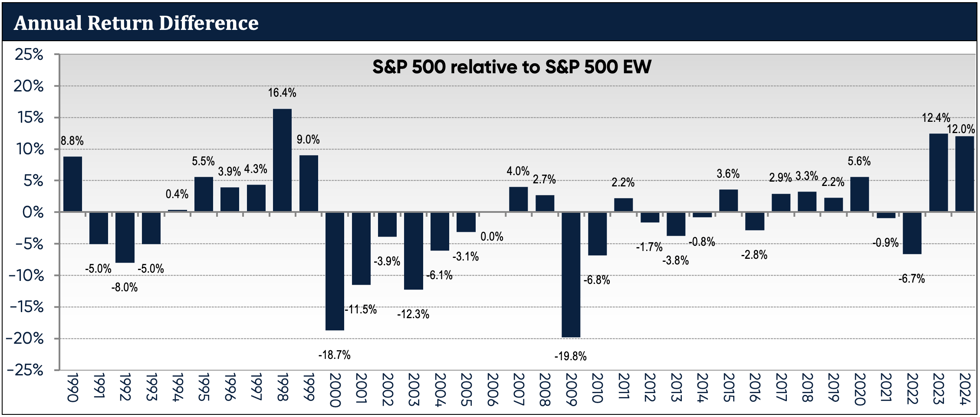
The performance of the S&P 500 relative to the S&P 500 Equal Weight has been extraordinary over the last two years. To illustrate this, we present the bar graph below which shows the year-to-year performance of the S&P 500 relative to the S&P 500 Equal Weight back to 1990, when the equal weight index track record begins.
In 2023 and 2024, the S&P 500 outperformed the S&P 500 Equal Weight by 12.4 and 12 percentage points, respectively. These are the second and third largest outperformance years in this 35-year record. With the effect of compounding, these two years combined for 29 percentage points of outperformance.
The only other two calendar year span in this record that resembles the last two years is the Tech Bubble years of 1998 and 1999, where the S&P 500 outperformed by 16.4 and 9 percentage points, compounding to 30 percentage points.
Source: FactSet
Following those two Tech Bubble years, the S&P 500 went on to cumulatively underperform the S&P 500 Equal Weight by 76.2 percentage points over the next six years from 2000 to 2005. We shall see in 2025 and beyond what happens this time, but we believe there is little fundamental support for the recent outperformance of the cap weighted index and expect that it is only a matter of time before the current trend meaningfully reverses.
HOW IT STARTED
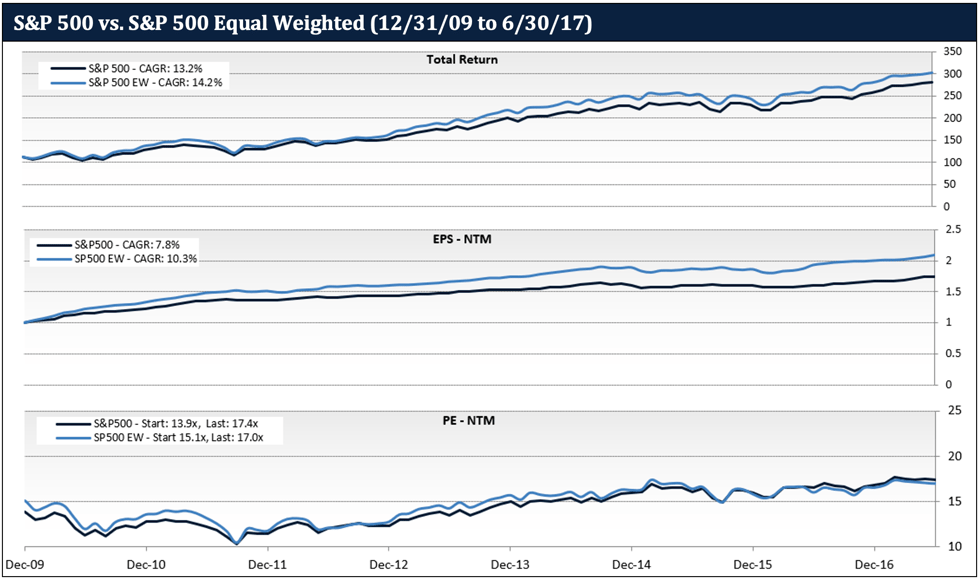
The outperformance of the S&P 500 relative to the S&P 500 Equal Weight is not supported by fundamentals. On the graphs below we show a comparative Price, Earnings, and P/E ratio for the S&P 500 and S&P 500 EW. We have about 15 years of P/E data from FactSet, so we have split the last 15 years into two 7½ year periods. The first graph presents the first 7½ years starting from the beginning of 2010 to the end of June 2017. This is to set a baseline for how the market behaved before mega-cap mania took over.
In the three panels below, the top graph shows price. We observe that the S&P 500 Equal Weight returned 14.2% annually, outperforming the S&P 500 return of 13.2% by one percentage point.
The middle graph shows earnings, which more than explains that return difference. The equal weight index grew earnings at an annualized rate of 10.3%, which is 2.5 percentage points faster than that of the cap weighted index.
Source: FactSet
The bottom graph shows the P/E ratios of the two indices. Over these 7½ years, the P/E ratios of the two indices stayed close to each other most of the time, with the cap weighted index averaging a 3% discount to the equal weight index. However, while the two P/Es stayed close, we began to see the coming inflation of mega-cap multiples, as the cap weighted index began this period at a deserved 8% P/E discount but finished at a 2% premium for a 10 percentage point swing.
Perhaps the market expected the cap weighted index to grow faster than the equal weight index in the years ahead. If it did, it was wrong.
HOW IT’S GOING
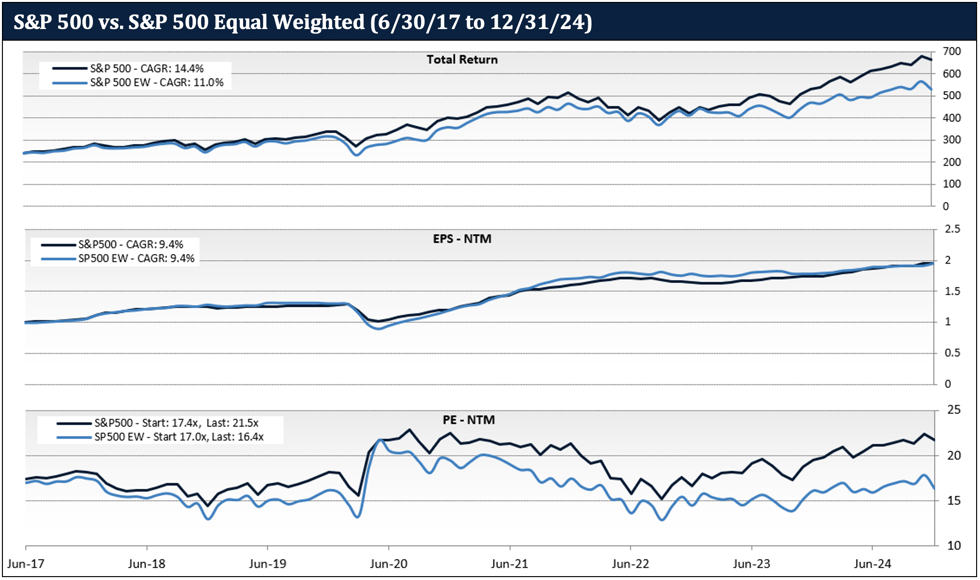
Now let’s compare the Price, Earnings, and P/E ratio for the second 7½ year period, from the end of June 2017 to the end of 2024.
In the top graph showing price, we observe a reversal in performance, with the S&P 500 annualized return of 14.4% outperforming the S&P 500 Equal Weight return of 11% by 3.4 percentage points.
While the cap weighted index had better returns, it did not have better earnings growth. In the middle graph showing earnings, we observe that the S&P 500 and the S&P 500 Equal Weight both grew earnings at the same rate, compounding at 9.4% per annum.
Source: FactSet
Thus, the cap weighted index outperformance has been driven entirely by relative multiple expansion. This is on display in the bottom graph. At the start of this period, the cap weighted index had a 2% P/E premium, but by the end of 2024 it had ballooned to a 32% premium. Again, this multiple expansion happened despite the cap weighted index growing much slower over the first 7½ years, and at the same rate over the second 7½ years.
Perhaps the market expects the cap weighted index to outgrow the equal weight index in the years ahead. That may be what is implied in the valuation multiple, but that is not what is explicit in estimates. Current consensus estimates forecast the cap weighted index growing only about one percent per year faster for the next three years. That is far too little excess growth to justify the big 32% premium.
Unless the cap weighted index can somehow grow substantially faster than the equal weight index, something it has failed to do in the past 15 years, it seems inevitable that its P/E multiple will compress toward parity with the equal weight index, driving significant future underperformance.
SIMPLE MATH
What would the return implication be if the S&P 500 P/E compressed to the level of the S&P 500 Equal Weight? We present below a simple “back-of-the envelope” calculation of such a scenario.
In our example, we assume both the S&P 500 and the S&P 500 Equal Weight grow at the same rate for the next five years. Specifically, we assume a growth rate of 9.4%, which is the EPS growth rate both indices achieved over the last 7½ years. We also assume both indices finish with a 16.2 forward P/E, which is the average P/E of the S&P 500 Equal Weight over the last 7½ years.
Before quibbling with our assumptions, note that, while we made specific assumptions for the sake of this example, one would get very similar relative return results under a wide range of growth rate and terminal P/Es, as it is the convergence of the multiples that would drive the relative performance.
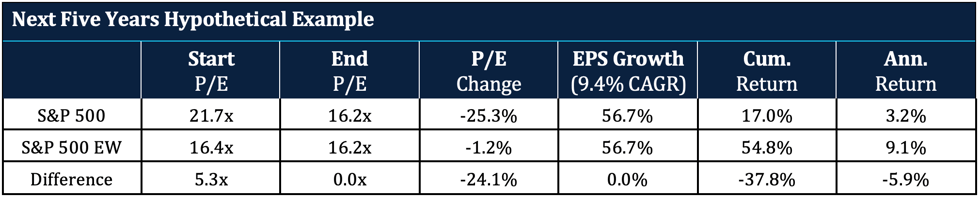
Source: Lyrical analysis
Given these assumptions, the simple math produces an annualized return of only 3.2% for the S&P 500, which is about 6 percentage points worse than the 9.1% return for the S&P 500 Equal Weight. Cumulatively, the S&P 500 would return just 17.0% over five years, compared to 54.8% for the S&P 500 Equal Weight, a difference of 37.8 percentage points.
After the S&P 500 returns over the last two years, it’s hard to accept this projection of significant cap weighted index underperformance. But math is math, and the historical record suggests that 38 percentage points of underperformance would be a conservative expectation, not an aggressive one.
A WARNING SIGN
Historically, after periods when the S&P 500 has outperformed the S&P 500 Equal Weight by the most, that trend has reversed, and the S&P 500 went on to significantly underperform in the years that followed. The table below chronicles the three-month periods when the S&P 500 outperformed the S&P 500 Equal Weight by the widest margins.
Since 1990, we have 418 rolling three-month periods to observe. The period when the cap weighted index outperformed the most was from 2023. In those three months OpenAI released ChapGPT-4, sparking the AI trade, while at the same time the rest of the market lagged due to the Silicon Valley Bank crisis. In those three months, the cap weighted index outperformed the equal weight index by an astonishing 10.1 percentage points. Including that period, five of these top 30 (shaded in blue) are from the recent AI era, including two from 2024.
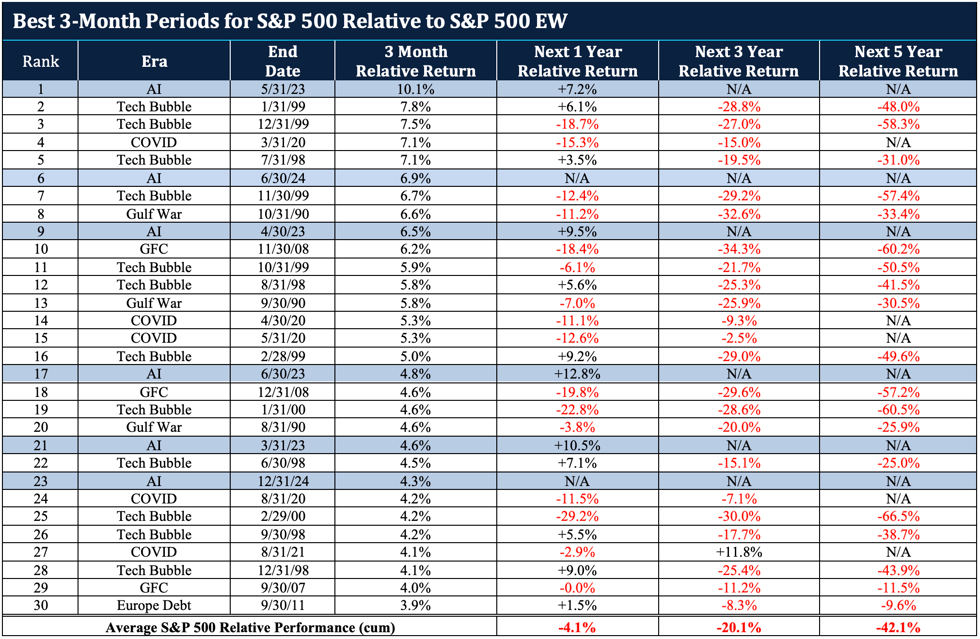
Source: FactSet
In addition to the relative performance in these three-month periods, the table includes the performance of the S&P 500 relative to the S&P 500 Equal Weight in the subsequent one-, three- and five-years. Notice all the numbers in red, indicating S&P 500 underperformance.
In the short run, acute outperformance of the S&P 500 over the S&P 500 Equal Weight has not always led to a reversal. There are several one-year periods where the cap weighted index continued to outperform, including the first two entries on this table. However, 57% of the time the cap weighted index underperformed over the next year, and the average underperformance for all the periods was 4.1 percentage points.
As we extend the time horizon to three years, performance reversal became the norm with rare exception. Of these 30 periods, there was only one observation when the cap weighted index continued to outperform for the following three years (row 27), and the average underperformance was over 20 percentage points.
When we extend the time horizon further to five years, performance reversal became inescapable. There have been no observations in this time frame where the cap weighted index continued to outperform. On average, the next five years produced over 42 percentage points of underperformance. That compares with the 38 points of underperformance we derived in our simple math example. As we said, 38 points may be a conservative expectation.
Admittedly, some of the periods in this table are too recent to have one-, three- and five-year subsequent returns, and it always is possible this time will be different. However, the consistency and magnitude of underperformance presented here is a damning historical record. It seems extremely unlikely that the cap weighted index, and the mega-cap growth stocks driving it, will continue to outperform the average stock. This seems especially likely given that the cap weighted index earnings growth historically has been worse, not better.
EQUAL WEIGHT GOOD, VALUE BETTER
As good as the case is for the S&P 500 Equal Weight, we believe there is something even better to consider, namely value stocks. The table below is like the table above with the one change being that the subsequent returns are for the S&P 500 relative to the cheapest quintile of the top 1,000 US stocks, rather than relative to the S&P 500 Equal Weight. It shows that historically what has been a good environment for the equal weight index has been a great environment for value stocks.
Looking at the one-year subsequent returns for these 30 periods, the cap weighted index underperformed the cheapest quintile by 10.2 percentage points on average. That’s 6 percentage points more outperformance than the equal weight index, which averaged 4.1.
Over the subsequent three years, the cheapest quintile outperformed the S&P 500 by 50.1 percentage points. That’s 30 percentage points more outperformance than the equal weight index, which averaged 20.1.
And, over the subsequent five years, the cheapest quintile outperformed the S&P 500 by 112.5 percentage points. That’s 70.4 percentage points more outperformance than for the equal weight index, which averaged 42.1.
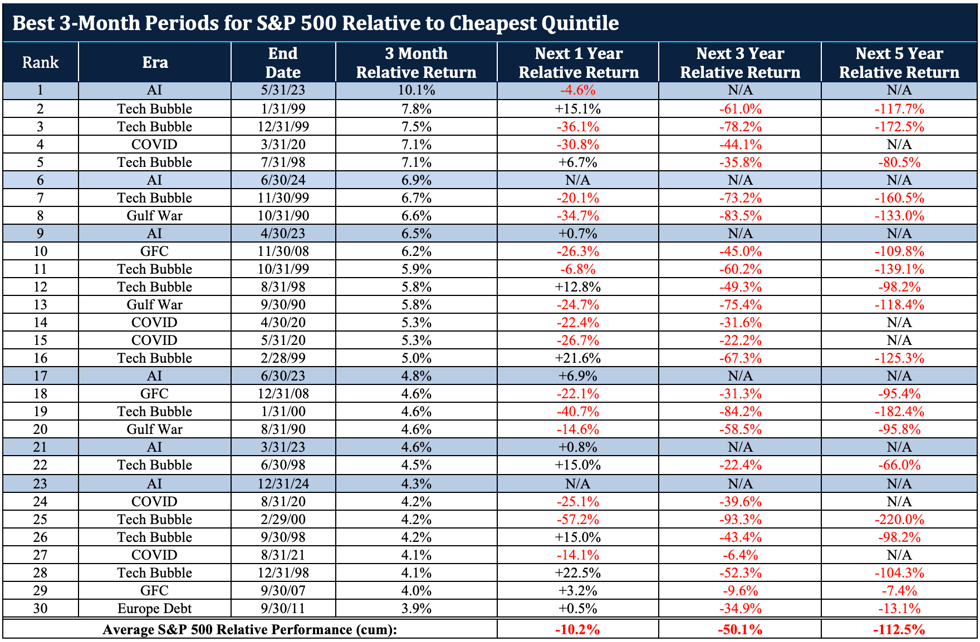
Source: FactSet
So, if you want to diversify away from the high valuation of the S&P 500, the S&P 500 Equal Weight has been a good choice, but the far better choice has been a portfolio of the cheapest stocks, like what we construct at Lyrical.
VALUATION SPREAD REMAINS WIDE
Historical data aside, what gives us the greatest confidence in our ability to outperform is the valuation and growth characteristics of our portfolio. Our full quarterly P/E history is presented on the graph below, along with the P/E of the S&P 500, with the bars at the bottom showing the valuation spread between the two.
Our CS composite ended the year with a P/E ratio of 12.1x, and our EQ composite P/E was 11.7x. The S&P 500 ended the year with a P/E of 21.8x, 36% above its average since our inception, and 85% higher than our current EQ portfolio. (Note: we use EQ for this calculation because it has the longer history.) This remains an incredibly wide valuation spread by historical standards.
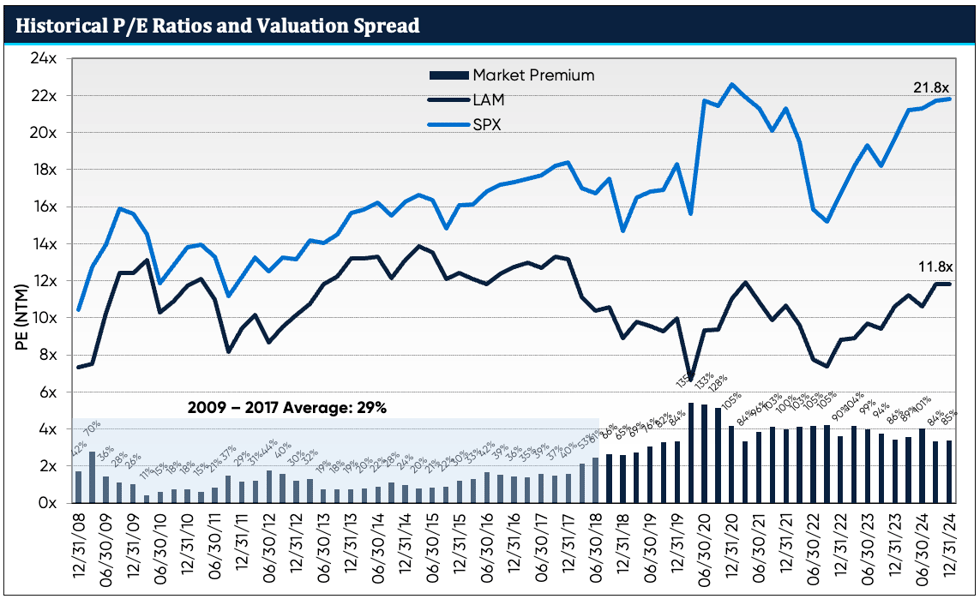
Source: FactSet
As we have been saying for some time now, we continue to expect this spread to eventually narrow, and return to around 30%, which was the average spread we experienced in the first decade of our firm. While we wait for that to happen, if the spread just stays where it is, our EPS growth should enable us to perform in line with the S&P 500. However, if the spread does narrow to the historical average, our outperformance should be significantly greater. By our rough math, reverting to a 30% valuation spread over five years would drive 7 percentage points of outperformance per annum, all else equal.
OUR UNCOMMON COMBINATION
A signature feature of Lyrical portfolios is our uncommon combination of both deep value and quality growth. Shown in the bar chart below on the left is a summary of our current valuation, as well as the valuations of our benchmarks. Valuation is important, but it isn’t everything. What matters in investing is not just what you pay, but also what you get, specifically the future earnings.
Shown in the line graph below on the right is the growth profile of our portfolio and the benchmarks. The lines at the top show the EPS growth history of our current CS and EQ composites, while the lines below them show the EPS growth of the S&P 500 and S&P 500 Value.
From 2007 to 2024, the S&P 500 has had an annualized EPS growth history of 7.2%. By contrast, our current portfolio has a growth history that is more than two percentage points faster. This growth profile is why we continue to believe the wide valuation spread justifiably deserves to narrow.
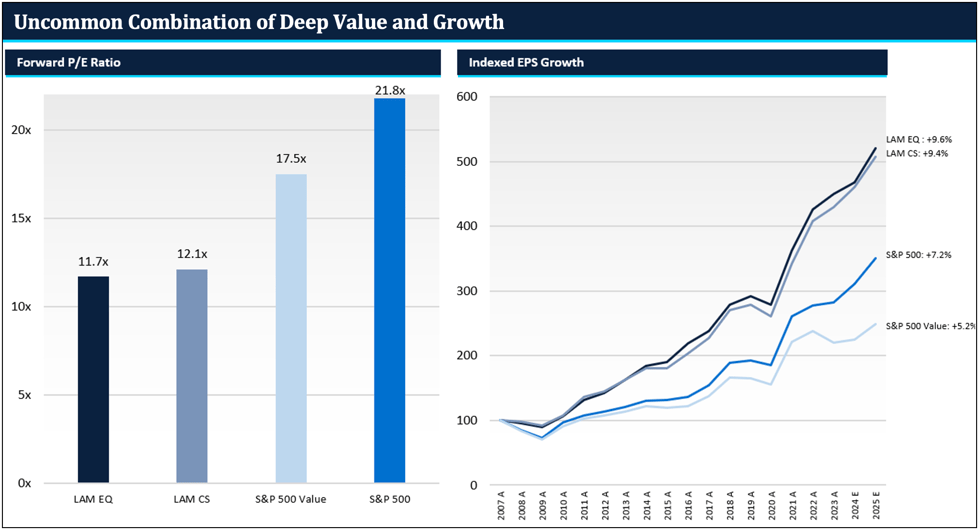
Source: FactSet. See Notes below.
CONCLUSION
The last two years have been an extraordinary environment, with mega-cap growth stocks propelling the S&P 500 returns so high that 78% of its constituents underperformed. Since 1990, we have only seen a two-year gap this wide between the S&P 500 and the S&P 500 Equal Weight at the peak of the tech bubble. That period ended in disappointment for the S&P 500, as five years later the S&P 500 had lost 6.6%, while the S&P 500 Equal Weight had gained 59.2%.
We believe our approach of owning attractively growing businesses at deep value prices has performed respectably in this extraordinary environment. Over the last two years we have significantly outperformed the S&P 500 Equal Weight and the S&P 500 Value. We even managed to outperform the cap weighted S&P 500 in 2023 despite not owning any of the Magnificent Seven, but we did not have enough big winners to repeat that feat in 2024.
It may feel like the dominating performance of mega-cap growth stocks will go on forever, but the historical data lead us to expect otherwise. In the past, when the cap weighted index outperformed by huge amounts, it went on to underperform by huge amounts in the following five years. Furthermore, the cap weighted index historically has not grown EPS faster than the equal weight index, and for all the hype around AI and the Magnificent Seven, consensus estimates project only modestly faster growth going forward. The fundamental case to support the 32% P/E premium of the cap weighted index over the equal weight index appears to be weak, to say the least.
As for our portfolio, most years our companies report earnings in line with our expectations, with a few positive and negative surprises. The mix of earnings outcomes in 2024 was not materially different than in any other year. We continue to find excellent new opportunities even in this rich market. During the year we added four new stocks to the portfolio with P/Es well below and growth rates well above the S&P 500. As a group, the four new additions had an average P/E of only 13.8x at the time of purchase, and an average historical EPS growth rate of 12%.
Our big picture view continues to be that the valuation spread between our portfolio and the S&P 500 is very wide today and should eventually narrow, which would drive substantial outperformance. The mega-cap mania of the last two years has delayed that event, but we still believe it is inevitable. This belief is based on the historical and projected earnings of our companies, which have demonstrated faster earnings growth than the S&P 500 over the last economic cycle.
I hope we have made clear both the opportunities we see in our portfolio as well as the dangers we see in the S&P 500. Extreme environments tend to exhaust themselves after two years or so, so we greet 2025 with great optimism. And, as always, we appreciate our investors for the trust and faith they have bestowed upon us. Thank you all, and we wish you nothing but the best in 2025.
Andrew Wellington, Founder, Chief Investment Officer
|
THIS IS NOT AN OFFERING OR THE SOLICITATION OF AN OFFER TO INVEST IN THE STRATEGY PRESENTED. ANY SUCH OFFERING CAN ONLY BE MADE FOLLOWING A ONE-ON-ONE PRESENTATION, AND ONLY TO QUALIFIED INVESTORS IN THOSE JURISDICTIONS WHERE PERMITTED BY LAW. THERE IS NO GUARANTEE THAT THE INVESTMENT OBJECTIVE OF THE STRATEGY WILL BE ACHIEVED. RISKS OF AN INVESTMENT IN THIS STRATEGY INCLUDE, BUT ARE NOT LIMITED TO, THE RISKS OF INVESTING IN EQUITY SECURITIES GENERALLY, AND IN A VALUE INVESTING APPROACH. PLEASE SEE WWW.LYRICALAM.COM/NOTES FOR A DISCUSSION OF CERTAIN MATERIAL RISKS OF AN INVESTMENT IN LYRICAL’S STRATEGIES. WHERE WE PROVIDE INFORMATION ABOUT PERFORMANCE THAT IS NOT THE ACTUAL PERFORMANCE RESULTS OF OUR INVESTMENT STRATEGIES (SUCH AS WHERE WE SHOW THE HYPOTHETICAL RESULTS UNDER THE CAPTION “SIMPLE MATH,” ABOVE), PLEASE NOTE THAT THERE ARE SUBSTANTIAL ADDITIONAL LIMITATIONS INHERENT IN USING SUCH PERFORMANCE INFORMATION. THOSE INCLUDE, BUT ARE NOT LIMITED TO, THAT ACTUAL TRADING AND THE ASSOCIATED EXPENSES DID NOT OCCUR, THAT MARKET CONDITIONS CHANGE OVER TIME, AND THAT NO INVESTOR HAD THE ACTUAL PERFORMANCE PRESENTED. PAST PERFORMANCE IS NOT NECESSARILY INDICATIVE OF FUTURE RESULTS. LAM – CS RESULTS ARE UNAUDITED AND SUBJECT TO REVISION, ARE FOR A COMPOSITE OF ALL ACCOUNTS. NET RETURNS INCLUDE A 0.75% BASE FEE. LAM – EQ RESULTS ARE UNAUDITED AND SUBJECT TO REVISION, ARE FOR A COMPOSITE OF ALL ACCOUNTS, AND SHOW ALL PERIODS BEGINNING WITH THE FIRST FULL MONTH IN WHICH THE ADVISOR MANAGED ITS FIRST FEE-PAYING ACCOUNT. NET RETURNS INCLUDE A 0.75% BASE FEE AND 20% INCENTIVE ALLOCATION ON RETURNS OVER THE S&P 500 VALUE®, SUBJECT TO A HIGH WATER MARK PROVISION.
THE S&P 500® IS WIDELY REGARDED AS THE BEST SINGLE GAUGE OF LARGE-CAP U.S. EQUITIES. THE INDEX THE INDEX INCLUDES 500 LEADING COMPANIES AND COVERS APPROXIMATELY 80% OF AVAILABLE MARKET CAPITALIZATION. THE S&P 500® VALUE DRAWS CONSTITUENTS FROM THE S&P 500®. S&P MEASURES VALUE USING THREE FACTORS: THE RATIO OF BOOK VALUE, EARNINGS, AND SALES TO PRICE. S&P STYLE INDICES DIVIDE THE COMPLETE MARKET CAPITALIZATION OF EACH PARENT INDEX INTO GROWTH AND VALUE SEGMENTS. THE S&P 500® EQUAL WEIGHT INDEX IS THE EQUAL-WEIGHT VERSION OF THE WIDELY-USED S&P 500. THE INDEX INCLUDES THE SAME CONSTITUENTS AS THE CAPITALIZATION WEIGHTED S&P 500, BUT EACH COMPANY IN THE S&P 500 EWI IS ALLOCATED A FIXED WEIGHT – OR 0.2% OF THE INDEX TOTAL AT EACH QUARTERLY REBALANCE. NOTES: ALL MARKET DATA IS COURTESY OF FACTSET. INDEXED EPS GROWTH DEPICTS THE HISTORICAL CHANGE IN EARNINGS PER SHARE OF THE COMPANIES IN THE LAM U.S. VALUE EQUITY STRATEGIES USING WEIGHTS IN THE LAM-EQ COMPOSITE AS OF DECEMBER 31, 2024. ACTUAL HOLDINGS, AND THEIR WEIGHTS, VARIED OVER TIME. EARNINGS PER SHARE IS COMPUTED USING CONSENSUS EARNINGS DATA PER FACTSET, WHICH INCLUDE CERTAIN ADJUSTMENTS FROM REPORTED, GAAP EARNINGS. PERIODS MARKED WITH AN “E” INCLUDE ESTIMATED EARNINGS PER SHARE. THE HISTORICAL PORTFOLIO P/E (NTM) CHART COMPARES THE WEIGHTED AVERAGE NEXT TWELVE MONTHS P/E RATIOS AS OF THE BEGINNING OF EACH QUARTER FOR THE LAM-EQ COMPOSITE AND THE S&P 500 INDEX. ACTUAL BEGINNING OF QUARTER LAM-EQ COMPOSITE WEIGHTS ARE USED. Tagged U.S. Value |
Original Post
Editor’s Note: The summary bullets for this article were chosen by Seeking Alpha editors.
Editor’s Note: This article covers one or more microcap stocks. Please be aware of the risks associated with these stocks.
Read the full article here
: Why I Changed My Mind Recently")

 Q4 2026 Earnings Call Transcript")
")
")
")