Q4 2025 Earnings Call Transcript")

")
Overall Objective and Strategy
(NYSEARCA:VOOG) is a Vanguard ETF that invests only in the growth companies of the S&P 500 based on the following criteria:
- Three factors are considered: earnings change/price ratio, sales growth and momentum.
- Eligible securities must meet liquidity and size requirements, and have positive reported earnings in the most recent quarters.
- The index is weighted by market cap and rebalanced at the end of the year.
- There are currently 234 holdings in the fund or roughly half of the S&P 500.
Portfolio Characteristics
Median Market Cap: $372.8 Billion
Earnings Growth rate: 23.2%
Return on Equity: 33.2%
P/E Ratio: 25x
P/B Ratio: 7.1x
Fund Expenses
The expense ratio for VOOG is 0.10% which is quite low, but is actually higher than some of its large cap growth ETF peers-
(VOOG)- 0.10%
(VUG) – 0.04%
(SPYG) – 0.04%
(SCHG) – 0.04%
Why I Think VOOG is a High Quality Fund
VOOG is a low cost index fund based on the S&P 500 Growth Index. There are several reasons why the fund is well thought out:
- VOOG selects growth stocks from the S&P 500 which has already gone through its own screening process to eliminate low quality companies.
- VOOG’s index tends to select growth stocks with a high return on equity. The average ROE for the companies in VOOG is 33.2%. Warren Buffett often mentions financial ratios when he discusses a business. He has said that the most important ratio to consider is return on equity.
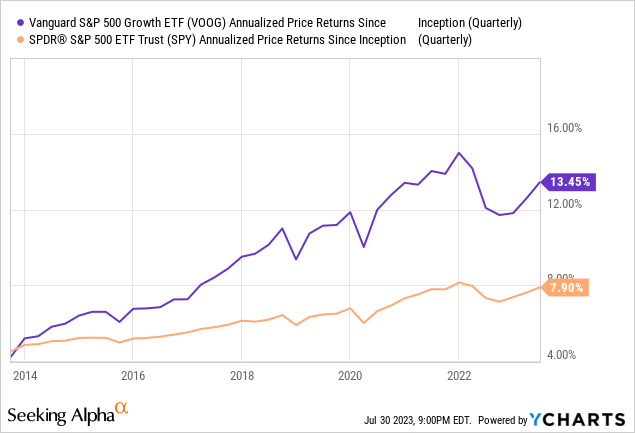
- VOOG has outperformed the S&P 500 over the last ten years.
- The Sharpe Ratio is a measure of risk adjusted performance. Over the last ten years, Morningstar computes a Sharpe Ratio of 0.82 for VOOG compared to the large cap blend category average of 0.72.
Holdings of Magnificent Seven Stocks
In the table below, I have listed the percentage holdings of the “Magnificent Seven” stocks held by VOOG and some its peers. I have included both GOOG and GOOGL in this group. Note that (META) is not currently in the VOOG portfolio, because it did not qualify in the last rebalancing at the end of last year. This partially explains why VOOG has lagged some of its peers year to date.
|
(VOOG) |
(VUG) |
(SPYG) |
(SCHG) |
(SPY) |
|
|
(AAPL) |
14.17% |
13.79% |
13.93% |
13.95% |
7.53% |
|
(MSFT) |
7.26% |
12.05% |
6.95% |
12.01% |
6.48% |
|
(AMZN) |
2.65% |
5.41% |
2.57% |
5.59% |
3.02% |
|
(NVDA) |
5.17% |
4.73% |
5.54% |
5.54% |
2.99% |
|
(GOOGL) |
3.51% |
3.38% |
3.75% |
3.75% |
2.03% |
|
(META) |
——– |
3.02% |
——– |
3.38% |
1.82% |
|
(TSLA) |
3.49% |
3.35% |
3.36% |
3.37% |
1.82% |
|
(GOOG) |
3.06% |
2.87% |
3.24% |
3.23% |
1.75% |
Past Performance
VOOG is classified by Morningstar in the “Large Growth” category. As a well run index fund, VOOG has performed quite well, although it has slightly underperformed some of its peers more recently. Some of this recent underperformance has been caused by not owning META in 2023.
Here are the annual performance figures computed by Morningstar as of July 28, 2023.
|
VOOG |
Category (LG) |
+/- Category |
Percentile Rank in Category |
|
|
YTD |
+24.68% |
+28.07% |
-3.39% |
64 |
|
1 Year |
+ 9.98% |
+15.86% |
-5.88% |
86 |
|
3 Year |
+11.28% |
+ 9.14% |
+2.14% |
36 |
|
5 Year |
+12.64% |
+11.34% |
+1.30% |
32 |
|
10 Year |
+14.07% |
+12.71% |
+1.36% |
24 |
Source: Morningstar
Long Term Fund Correlations Table
The following table of correlations compares VOOG with some growth stock ETFs. I have also shown the annualized return and daily standard deviation for the time period from November 2013 through June, 2013.
VOOG Correlation Table (Portfolio Visualizer)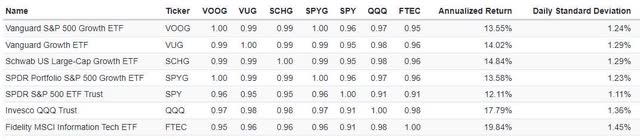
It is not too surprising that the correlation of VOOG with SPYG is 1.00, since they both use the same underlying index. The correlation with VUG and SCHG is also very high at 0.99. As expected, the correlations with SPY, QQQ and FTEC are somewhat lower, although still at 0.95 or higher.
The annualized return for VOOG over the ~10 year period is almost identical to that of SPYG, with SPYG getting a tiny edge because of its lower expense ratio. QQQ and FTEC have the highest annualized returns, but they also have higher risk/standard deviations because they are narrower sector funds.
ETF Ratings
- Morningstar: 4 Stars (5/31/2017)
- FactSet: A (7/28/2023)
- Efficiency: 97
- Tradability: 100
- Fit: 80
Volatility Measures (as of 06/30/2023)
1 Year Beta: 1.07 (more volatile than the S&P 500)
1 Year R- Squared: 0.918 (fairly high correlation with S&P 500)
1 year Sharpe Ratio: 0.65
3 year Sharpe ratio: 0.55
1 Year Standard Deviation: 22.98
Source: fidelity.com
Availability of Options For Hedging
VOOG does have a few option contracts available, but the liquidity on these is quite poor and the bid-asked spreads are very wide. For someone who wants to use options to set up as covered call on a growth oriented ETF, I would recommend using QQQ which has far more option contracts available with much better liquidity and lower bid-asked spreads.
Here are the top ten VOOG holdings as of June 30, 2023:
Top 10 Holdings % Weight
|
Apple (AAPL) |
14.17% |
|
Microsoft (MSFT) |
7.26% |
|
Nvidia (NVDA) |
5.17% |
|
Alphabet Class A (GOOGL) |
3.51% |
|
Tesla (TSLA) |
3.49% |
|
Alphabet Class C (GOOG) |
3.06% |
|
Amazon (AMZN) |
2.65% |
|
UnitedHealth Group (UNH) |
2.21% |
|
Exxon Mobil (XOM) |
2.14% |
|
Visa (V) |
1.90% |
Summary
VOOG is a well-diversified fund with a large cap growth tilt. It has $7.8 billion in assets invested in 234 securities. VOOG pays small dividends and has a relatively low 30 day SEC yield of 1.13%.
VOOG is an excellent fund that can serve as a core holding, especially in a retirement account. It is fairly liquid and trades about 115,000 shares a day, but it is not the best ETF for short term day traders who are better off using something like QQQ or SPY.
As a general rule, Vanguard does a great job in running an ETF with low fees. In many ways, VOOG can be a “set and forget” investment that does not need much maintenance. But in this case, you may be able to get slightly better performance with SPYG, VUG or SCHG because of their lower expense ratio.
Read the full article here
 Q4 2025 Earnings Call Transcript")

")