")


")
The USD is starting to strengthen, in line with higher bond yields, and these two catalysts could be detrimental for growth / momentum stocks, which thrive on low interest rate expectations.
I have previously written that the energy markets are outperforming the broad market. This space includes:
- Oil & gas, which I opined could be ready to take off in 2H’2023
- Uranium, which could be ready for its next bull leg higher after a 1.5 year consolidation
A strengthening USD adds more weight to my thesis that these cyclical sectors are likely to outperform the broad market. This is because a stronger USD implies higher bond yields due to higher-than-expected inflation. Remember that the Fed has said in July it would be data dependent, and would tighten if high inflation is not curbed.
Summer months tend to be a lull for FX, and as we approach mid-August to early-September, the probability increases for FX markets to make bigger moves.
Now, on to the charts.
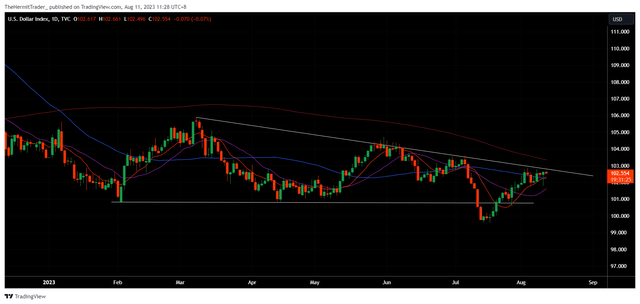
The dollar index, which measures the USD’s strength against a basket of major currencies, is now testing downtrend resistance. My gut feel tells me it will breakout higher. For starters, the USD had a false breakdown back in mid-July, which would have sucked in a lot of shorts, who are now forced to cover. As the saying goes, “from false moves come fast moves in the opposite direction”.
Daily Chart: Dollar Index
Tradingview
In addition, US CPI data on 10 August came out below expectations at 3.2% vs 3.3%. Core CPI also underwhelmed at 4.7% vs 4.8%. In response, the USD sold off initially, but recouped all losses and closed the day green. This tells me that buyers are stepping in. Nuances like this point to us the path of least resistance (higher).
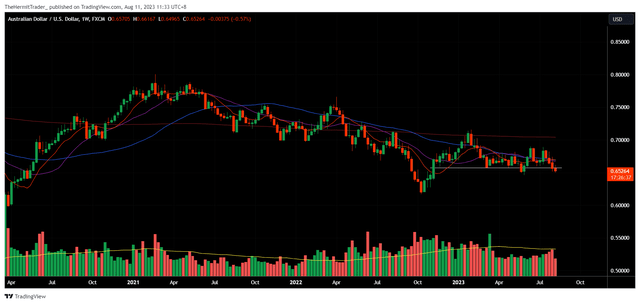
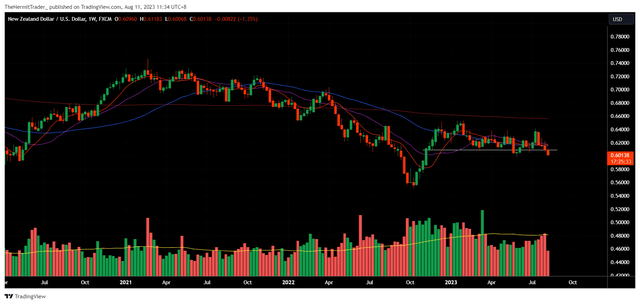
Antipodeans (Australian Dollar, New Zealand Dollar) and the Canadian Dollar look vulnerable if the USD continues to march higher. All three are trading at key support levels, and a breakdown could pave their next leg lower.
Below, I show the weekly charts of the AUD/USD and NZD/USD. Both are testing 1.5 year supports.
Weekly Chart: AUD/USD
Tradingview
Weekly Chart: NZD/USD
Tradingview
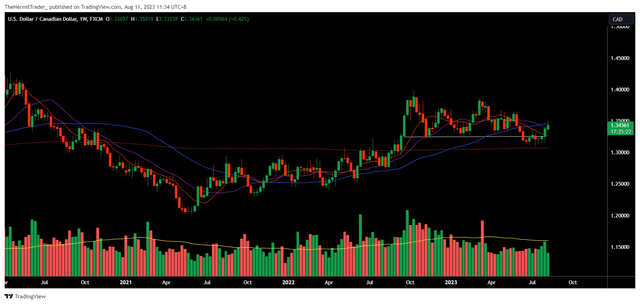
The Canadian Dollar is not as weak as the Aussie and Kiwi, perhaps because of the strength in crude oil prices. Nevertheless, USD/CAD has bounced higher from support levels, and the path of least resistance looks higher (weaker CAD).
Weekly Chart: USD/CAD
Tradingview
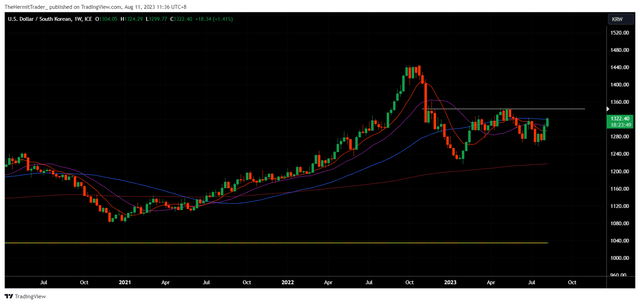
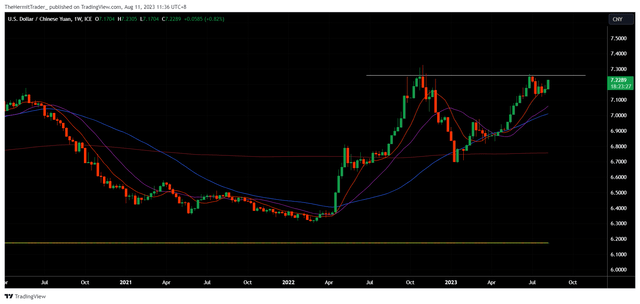
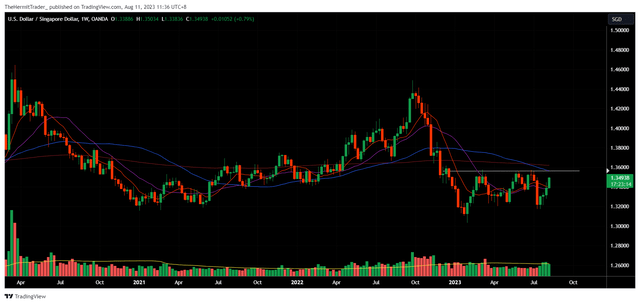
The USD’s strength is also clear against Asia currencies. Below, we may observe from the weekly charts that the USD is building bases against the Korean Won, Chinese Yuan, and Singapore Dollar. Similar to the AUD, NZD and CAD covered above, USD-Asia currency pairs have also been consolidating for 1.5 years now.
Weekly Chart: USD/KRW
Tradingview
Weekly Chart: USD/CNY
Tradingview
Weekly Chart: USD/SGD
Tradingview
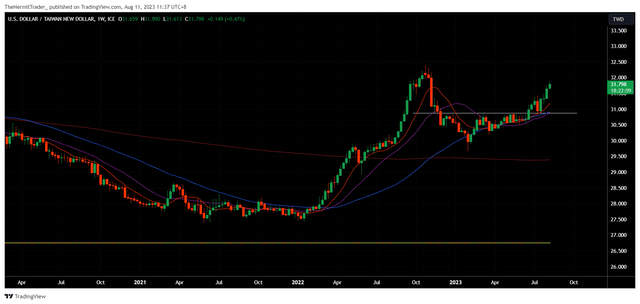
The Taiwanese Dollar looks amongst the most vulnerable against the USD. USD/TWD has already broken out of its base.
Weekly Chart: USD/TWD
Tradingview
The USD strength appears to be in line with the rise in bond yields. Below we can see the close correlation between the USD and the 10Y treasury yield.
Despite falling inflation (lower CPI data), bond yields have not corrected lower. In fact, they have pushed higher and are close to new highs. This could be a tailwind for the USD to head higher.
Monthly Chart: Dollar Index (in purple) vs US10Y Yield (in orange)
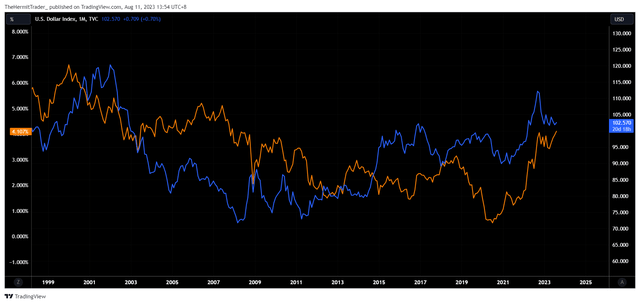
Tradingview
What are the likely repercussions for the equity markets? If we look at the daily chart of the dollar against the S&P 500 (SPY), they share a negative correlation since 2020. This means that if the USD rallies from here, it will likely place downward pressure on equities.
Daily Chart: Dollar Index (in purple) vs S&P 500 (in orange)
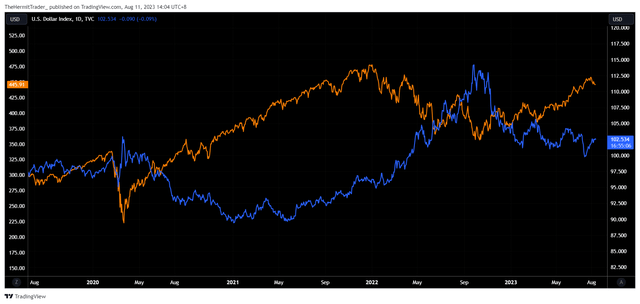
Tradingview
From here, I will suggest watching the USD as an additional tool to determine whether to increase / decrease exposure in equities. I am currently long the USD (against CNH), and plan to buy into equities if and when the USD starts to show signs of weakness.
For those that want exposure to the USD, and do not have a FX margin account to trade FX, then you may consider an ETF that longs the USD, such as the Invesco DB US Dollar Index Bullish Fund (NYSEARCA:UUP).
Invesco DB US Dollar Index Bullish Fund ETF (UUP) reflects the USD’s value against six of the world’s major currencies – the Euro, Yen, Pound, Canadian Dollar, Swedish Krona and Swiss Franc.
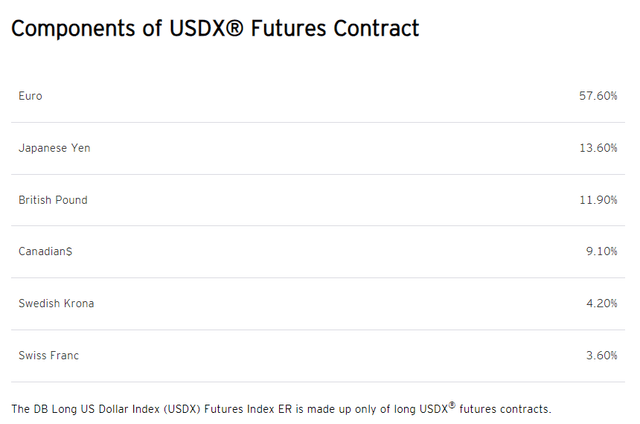
Invesco
On the weekly price chart, UUP is close to its breakout level. It has been consolidating for 9 months in a range, and could be ready for its next leg higher.
Weekly Chart: UUP
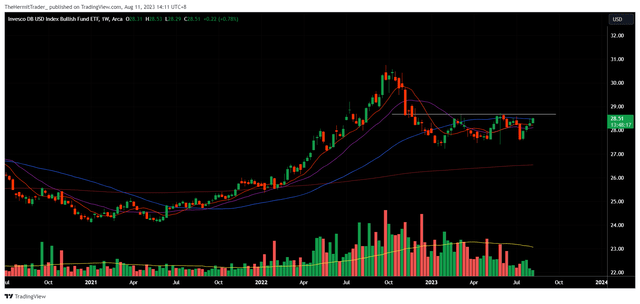
Tradingview
UUP aims to track the long USD futures contract, and as we may observe from the performance chart below, UUP tracks the benchmark pretty well.
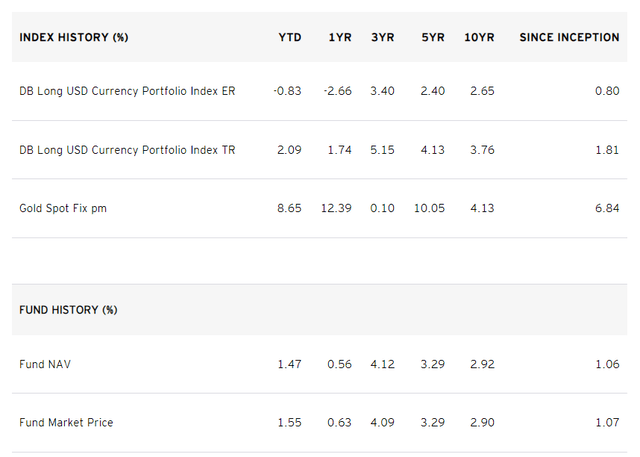
Invesco
UUP also pays a dividend (surprise, surprise) of 0.87%. This dividend comes from the interest rate differential between the USD and the currencies that the ETF is short.
For example, if the ETF is long the USD against the EUR, the investor sits on a positive carry as the benchmark interest rate in the US is higher than that of in the Eurozone.
That said, 0.87% is slightly low, as the European Central Bank’s benchmark interest rate is at 4.25%, while the Fed interest rate is at 5.5%. The interest rate differential between the USD and top holding EUR is already 1.25%.
The Bank of Japan’s benchmark interest rate is -0.10%. This means the interest rate differential between the USD and second top holding JPY is 5.6%.
That is why I have a margin FX trading account, which more accurately reflects this interest rate differential, which can be useful to build FX positions with positive carry. This is a slight downside for UUP.
If the USD does get going, there could be good upside, with 120 the target. 120 is the pivot of a huge multi-decade base. This represents ~15% upside from current levels. I am using the dollar index chart as UUP was incepted in 2007.
Quarterly Chart: Dollar Index
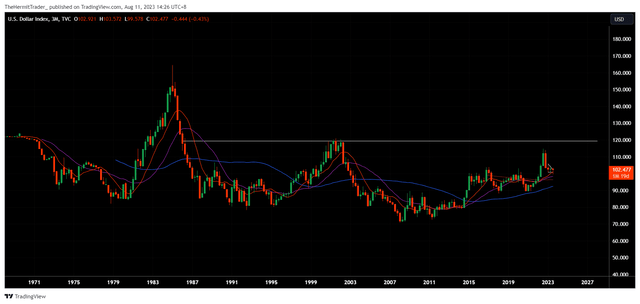
Tradingview
Overall, the USD looks primed to head higher, in line with bond yields. Lower than expected inflation data has been unsuccessful in pushing these two markets lower, which is a clue that price wants to go higher.
As we head towards the end of summer months, FX volatility might pick up, and we could see a big move in the USD. The USD has been carving out a multi-decade base since 1986, and there is ~15% upside to the pivot of this base.
The UUP ETF represents a functional vehicle for equity investors to long the USD. It tracks the dollar index pretty well, but the distribution yield is at the low side, taking into account the positive carry the FX positions should provide. Nevertheless, it should do the job in providing capital gains if the USD does take off higher.
Read the full article here
")

")

")
")
 Analyst/Investor Day Transcript")

")