")

")
")
Saturn Oil Should Go to the Moon
I first started buying shares of Saturn Oil & Gas Inc. (TSX:SOIL:CA, OTCQX:OILSF) about a year ago. Since then, they have completed a transformative acquisition of Ridgeback Resources Inc. Despite very attractive metrics for both the acquisition and the pro forma combined company, the shares have been about flat since then, with some volatility. As I will demonstrate, both via free cash flow projection as well as via reserve valuation, the shares (with the usual caveats) should be worth 4x-6x the current price as WTI US$75-80.
The Company
Saturn Oil & Gas Inc. is a Canadian light oil, natural gas and natural gas liquids (NGLs) producer. Saturn grew through acquisitions. The latest acquisition was that of Ridgeback Resources Inc., closed in the last month of Q1. The first full quarter of combined operations was 23Q2, which Saturn just reported on 8/14.
Some Initial Numbers
The company provided 2023 pro forma (combined Saturn and Ridgeback) guidance at the time of the acquisition, and they kept it at the time of the reported Q1 results (that only included 1 month of Ridgeback results and assumed WTI oil at US$80). The guidance was as follows (note, prices are in Canadian Dollars:
2023 Por Forma Ridgeback Acquisition Guidance (Saturn Corporate Presentation)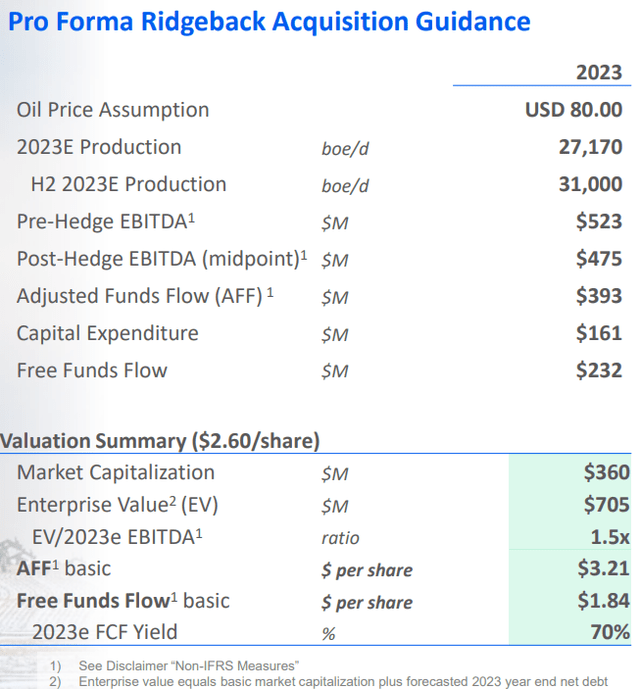
Source: Saturn Corporate Presentation
What immediately attracts attention in the above tables is the claimed 70% free cash flow (FCF) yield on basic market cap. It is a bit misleading however, as it is as of the end of 2023, assumes WTI $80 and H2 production of 31 Mboe/d (thousand barrel of oil equivalent). The above FCF is also PF only 10 months’ Ridgeback contribution (Feb-Dec). Full 12 months would have been ~C$250mm.
So far, the 2023 weighted average WTI has been below $80 (with AECO natural gas and NGLs suffering as well), production suffered in Q2 due to Alberta wildfires and lower FCF begets lower CapEx, which begets lower AFFO (adjusted funds from operation), which begets lower FCF.
Adjusted Funds Flow Sensitivity (Saturn Corporate Presentation)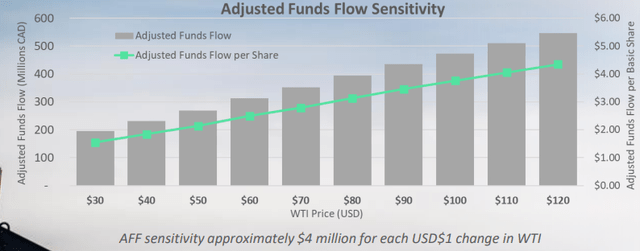
Source: Saturn Corporate Presentation
The same presentation claims that US$1 change in WTI changes AFFO by approximately C$4mm per year. Approximately 54% of oil production is hedged for 2023 and royalties percentages go up and down together with the oil price. Below is a simplified hedging table:
Saturn Oil Hedging Summary (Saturn Oil Corporate Presentation)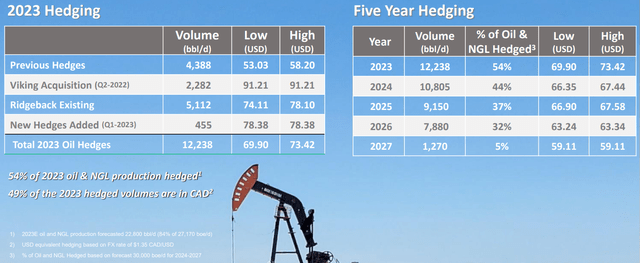
If you are interested in how hedges roll off over time with better precision, here’s the table from the Q1 MD&A:
Saturn Oil Hedging (Saturn Oil MD&A)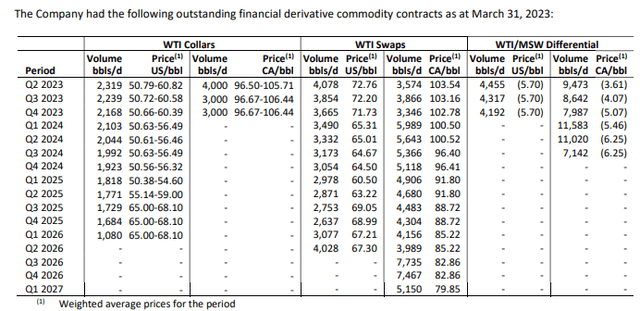
The Blessing and the Curse of the Loan
Saturn got financing for its several successive acquisitions, including the latest one from Michael Dell’s family office. They were not allowed to put the name in the press releases, but they did mention it in conference calls. Nobody wants to be associated with fossil fuels nowadays. The Ridgeback acquisition was very cheap and included both the debt and the equity components:
Ridgeback Acquisition Numbers (Saturn Oil Corporate Presentation)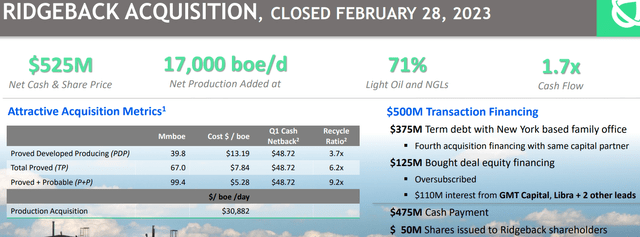
As of the end of Q2, Saturn’s net debt was C$510mm, and they had a very aggressive amortization schedule of C$25.4mm per month + 2.5% exit fee on that amount through April 2024, then lower amounts:
Senior Loan and Repayment Schedule (Saturn Oil MD&A)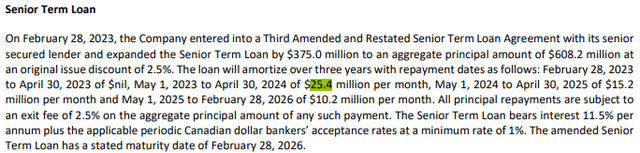
Source: Saturn Q1 MD&A
The bad news is the loan has an 18%+ interest rate and the amortization in the first year is very aggressive. The good news is… the loan has an 18%+ interest rate and the amortization in the first year is very aggressive – each quarter’s repayment of C$76.2mm (+2.5% exit fee) results in the interest cost for the subsequent quarter declining by ~C3.5mm.
Real Free Cash Flow
Let’s calculate annualized FCF assuming conservative netback of ~C$42 from Q2 (the month where Alberta wildfires and resulting lower production plus first quarter of integration, combined with low commodity prices drove it to below trend), as per below:
Saturn Oil 23Q2 Netback (Saturn Oil 2023 Q2 MD&A)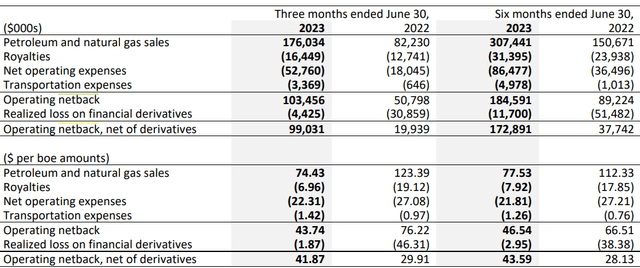
Source: 2023 Q2 MD&A
The current production per management on the Q2 earnings conference call is ~28.3 Mboe/d. Assuming roughly similar annualized production, the netback per quarter is 28,300 x C$42 x 92 days = ~C$109mm.
Less C$25mm quarterly cash interest, we arrive at approximate adjusted funds from operations (AFFO) of C$84mm per quarter. Subtracting C$78mm of debt repayment we have about C$6mm left over per quarter for CapEx, at least until the debt repayments step down in May 2024 (or until debt is refinanced).
However, there is also ~C$40mm of cash that the company had on the balance sheet as of Q2E plus the business interruption insurance proceeds for the wildfires. So CapEx for 23H2 should be about C$50mm give or take, which is a far cry from the prior guidance of ~C$120mm (that would include production growth).
Still, Saturn’s reservoirs are conventional, with the lower declines than shale and even with reduced CapEx they should be capable of at least continue paying the debt down, thereby reducing interest expenses. They will however not get to the planned 31+ Mboe/d by year end.
Let’s Time Travel
Let’s travel about 1 year into the future. Assuming debt repayments continue and then a refinancing happens at a lower interest rate, the interest expense drops from the current C$26.4mm/quarter by about C$60mm a year. Assuming the same conservative 28.3 Mboe/d production at C$42 netback, we arrive at AFFO of C$94mm per quarter or C$376mm per year (note that it is below prior company guidance for 2023 at WTI $80 of C$393mm).
Assuming CapEx of C$160mm to maintain production (also conservative, since the 2023 guide included growth), we arrive at FCF of C$233mm (below the 2023 guidance, which will likely be updated in the next couple of weeks).
There are ~142mm shares (assuming 2mm dealer options are exercised and 1.3mm stock options are exercised) plus ~16MM warrants with strikes CAD$3.2+, plus 7MM performance warrants for management (C$2.50 strike price, see below).
Fully-diluted share are ~165mmm, but the debt then drops by C$75mm due to exercise proceeds.
Management Incentives
Whereas the management in the past were incentivized (via the compensation structure) to grow the company, now they are more aligned with shareholders via a 7 million shares’ worth of options with strike prices of C$2.50, that vest in equal tranches as the share price reaches C$4, C$6 and C$8. The “growth at all costs” era appears over for Saturn.
Valuing Saturn using FCF
If we assume FCF of C$233mm and 142mm shares, we arrive at FCF of C$1.64 per share per year, which is 63% FCF yield on market cap (current price is C$2.62). With a target FCF yield of 12%, the price target then is C$13.67 or US$10.12, or about 5.2x the current price.
Assuming fully-diluted 165mm shares, but debt decrease by extra C$75mm (annual interest goes down by ~C$12mm and FCF becomes C$245mm, FCF per share is C$1.49 per year (57% on market cap) and price target becomes C$12.42 (US$9.20), or about 4.7x the current price.
Valuing Saturn using Reserve Value/NAV
This is going to be slightly tricky as the reserve reports are produced at the end of calendar years and are available for the acquired part of Ridgeback and the legacy Saturn as of the end of 2022, but not for the combined entity.
Nonetheless, on March 14th 2023, Saturn released the document outlining the reserves for both parts: Saturn Oil & Gas | Saturn Oil & Gas Inc. Announces 62.9 Million BOE of Reserves and Proved Developed Producing Net Asset Value (NPV10 BT) Increases 54% to $6.92 per Fully Diluted Share
While the assumed commodity prices are slightly different between both parts, they are conservative and average to about WTI US$80 for next several years, and AECO gas at ~C$4.10.
I took the numbers from those reports and performed some calculations, discounted at 0%, 5% and 10% a year. Below are the results:
Standalone legacy Saturn 2P YE22, before taxes
NPV0 C$2.3B.
NPV5% C1.8B.
NPV10 C1.4B.
Ridgeback 2P YE22, before taxes
NPV0 C3.1B.
NPV5 C2.3B.
NPV10 C1.7B.
Totals:
NPV0 C5.4B.
NPV5 C4.1B.
NPV10 C3.1B.
Conservatively assuming taxes of 30%:
NPV0 C3.8B.
NPV5 C2.9B.
NPV10 C2.2B.
Less C$550mm debt as of 23Q1 (conservative, real number at 23A2 is only C$510mm)
NPV0 C3.2B or US$2,370mm.
NPV5 C2.3B or US$1,700mm.
NPV10 C1.6B or US$1,120mm.
Assuming zero dilution (~140mm shares):
NPV0 per share C22.85 or US$17.
NPV5 per share C16.43 or US$12.17.
NPV10 per share C11.43 or US$8.47.
Assuming ~20mm warrants/RSUs will be converted to shares for C$60mm proceeds
Add C60mm proceeds.
NPV0 C3.26B or US$2,415mm.
NPV5 C2.36B or US$1,744mm.
NPV10 C1.66B or US$1,164mm.
~160mm fully-diluted shares:
NPV0 per share C20.38 or US$15.10.
NPV5 per share C14.75 or US$10.93.
NPV10 per share C10.38 or US$7.69.
I don’t believe 10% discount rate should be applied since the commodity prices will increase with inflation, but in any case we get a reserve-based price target of $C10-15 (US$8-12) @WTI US$80; not counting unbooked locations. Which is 4-7.5x the current share price.
Risks
Why does this opportunity exist? First of all, Saturn was a small company and grew rapidly, likely under the radar for most investors. But there are risks.
If oil prices go down and stay down, the aggressive mandatory term loan repayment may cause severe stress for the company (although the aggressive hedging near-term would help). Operational execution has risks as well. Other risks include nature and other accidents, as we saw with Alberta wildfires.
The amounts available for CapEx in the near term are depressed, which can also cause production declines.
Nonetheless, I like the balance of the risk and potential reward for this investment. If risks do not materialize, and if management continues to execute, the potential return can be significant. Which is the way I like it.
Editor’s Note: This article discusses one or more securities that do not trade on a major U.S. exchange. Please be aware of the risks associated with these stocks.
Read the full article here
")
")

")
")
 2026-04-01")
")

")