With growth bulls in the driver’s seat and the Invesco QQQ ETF (QQQ) up a startling 43.6% YTD, it is tough to be optimistic about value names that have lost their allure almost completely.
More specifically, while the market is seemingly pricing in more certainty around global supply chains, inflation receding, interest rates becoming less of an issue as a consequence, more flexibility for producers and less stress for consumers, it has become much harder to defend strategies revolving around fundamentally sound but for some reason underpriced stocks as they are either delivering measly gains or are edging lower in the worst case. However, today I will make an attempt to do so, with an updated take on the Alpha Architect U.S. Quantitative Value ETF (BATS:QVAL).
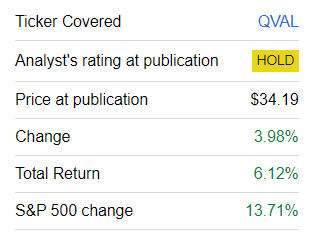
My previous note on QVAL was published in December 2022, when I was less optimistic about this value/quality mix and thus opted for a Hold rating. Since then, QVAL has solidly underperformed the S&P 500 index because, as I said above, bulls favored growth stories amid inspiring inflation data and the AI hype.
Seeking Alpha
To bring a bit more color, something atypical has happened to QVAL this year. The ETF saw four red months in a row (February-May), which has never happened since its launch in 2014, with the exception being 2015, when it was declining consistently from May to September. The previous time it had three loss-making months in a row was in January – March 2020 amid the coronavirus market drama.
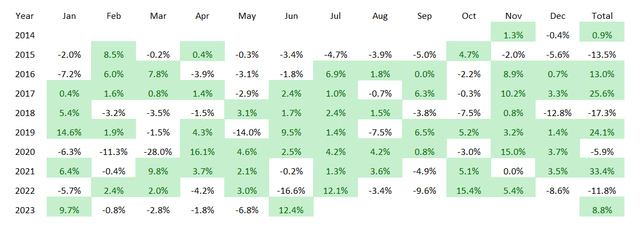
QVAL monthly and annual performance (Created using data from Portfolio Visualizer)
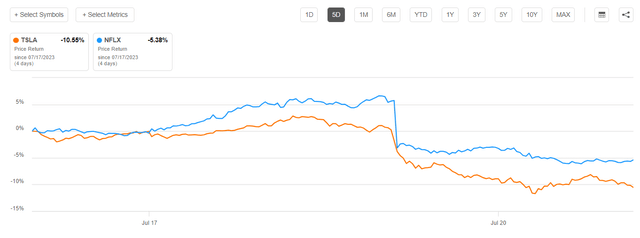
However, at this point, I am more confident about QVAL’s short-term prospects due to two principal factors 1) fundamental robustness of its portfolio, with impressive growth/quality/value balance, and 2) potential cracks in the tech rally. Regarding the latter, with Netflix (NFLX) and Tesla (TSLA) quarterly earnings disappointing the market recently, it is reasonable to mull over gaining some protection against a potential broad correction in tech and quasi-tech darlings, and doing so with QVAL makes sense.
Seeking Alpha
Nevertheless, there is an outsized oil price risk in this mix (47% energy sector exposure) that might ultimately nullify its defensive effect; there are other risk considerations as well. So I would recommend proceeding with caution and carefully weighing the pros and cons before longing QVAL.
The Alpha Architect U.S. Quantitative Value ETF changed its investment mandate a few times in the past, switching from an active model to a passive one and then to an active again. Since January 2022, it has not been tracking any index. According to the prospectus, at this point, its active strategy screens the universe of liquid U.S. stocks using the proprietary “value trap” tests, paying attention to accruals among other parameters, measuring valuation using the Total Enterprise Value/Earnings Before Interest and Taxes ratio, also assessing “current profitability, stability, and recent operational improvements,” with a goal to compose an equally-weighted portfolio of 50 to 100 positions. Among the sectors, QVAL has no interest in financials, and for good reason as the TEV/EBIT ratio is of no use when it comes to banks and the like. However, other sectors might be absent in the portfolio at times, e.g., the ETF currently has no exposure to utilities and real estate as well.
This strategy looks nicely calibrated and potentially capable of creating strong value stock cohorts. But what is in reality inside the portfolio?
Consider the following dichotomy first. There are equity portfolios with the mid-single-digit earnings yields backed by the mid-to-high double-digit forward EPS growth rates. They are in the limelight when markets are ebullient, monetary policy is supportive or there is at least an expectation it would become supportive soon enough, and investors are ready to buy into growth stories irrespective of their prices. At the same time, there are portfolios that offer much juicier yields, but resulting from bleaker weighted-average growth rates, typically much lower than 10%. They perform strongly when the appetite for growth is subdued. Truly, value investing is not monochrome, and reviewing a portfolio using these two metrics is not the only possible and obviously not the best way, yet it is simple and universal enough to apply across sectors. Of course, when we can add enterprise value, EBITDA, cash flow, and other parameters, we should do so for a more comprehensive view and more informed investment decisions.
But what if a 21% earnings yield comes with an over 35% EPS forward growth rate? This is QVAL’s phenomenon. And I believe it is worth paying attention to it. Below is a comparison of the principal metrics as of July 20 and as of December 5.
| Metric | 20-Jul | 5-Dec |
| Market Cap | $29.2 billion | $18.87 billion |
| EY | 21% | 20.2% |
| EPS Fwd | 35.2% | 31.1% |
| P/S | 1.15 | 1 |
| Revenue Fwd | 9.2% | 23.1% |
| EBITDA/EV | 21.4% | 24% |
| EV/S | 1.33 | 1.14 |
| ROTC | 22% | 23.9% |
| Cash Flow Yield | 25% | 18.6% |
Computed using data from Seeking Alpha and the fund
| Sector | July | December |
| Materials | 5.7% | 24.6% |
| Information Technology | 2% | 5.3% |
| Industrials | 16.6% | 9.8% |
| Health Care | 2.1% | N/A |
| Energy | 47% | 37.4% |
| Consumer Staples | 3.7% | 1.6% |
| Consumer Discretionary | 18.8% | 20.5% |
| Communication | 3.9% | N/A |
Computed using data from QVAL and iShares Russell 3000 ETF (IWV)
Despite the fact that about 67.5% of QVAL’s net assets are now allocated to stocks that were absent in the December version, and also despite the sector exposure changes (healthcare and communication added and exposure to industrials and energy increased), the fund still has a phenomenally attractive valuation, robust quality, and strong growth metrics as well. Its weighted-average market cap has advanced significantly, but the EY has even improved, now standing at about 21% (a P/E of 4.6x). I perfectly understand that energy (exploration & production, refining, etc.) and materials plays are the top contributors, and earnings-based ratios are not the best choice for them, thus this figure should not be reviewed in isolation.
| Symbol | Weight | Sector | Quant Valuation Grade | Quant Profitability Grade | EY |
| PBF Energy (PBF) | 2% | Energy | A | A- | 62% |
| Alpha Metallurgical Resources (AMR) | 1.8% | Materials | A+ | A+ | 57% |
| Peabody Energy (BTU) | 1.9% | Energy | A- | B+ | 54% |
| CNX Resources (CNX) | 2% | Energy | A- | B | 49% |
| Scorpio Tankers (STNG) | 1.8% | Energy | C+ | A+ | 42% |
Computed using data from Seeking Alpha and the fund
Thankfully, there are no financials in the basket, and EBITDA/EV can be used. And at around 21.4%, this earnings yield (adjusted for debt) tells a similar story, especially considering EBITDA is forecast to grow by around 16.1% portfolio-wise. The median growth rate looks completely adequate at 9.5%, as per my calculations.
Next, while EV/Sales is only at 1.3x, the WA sales growth rate is above 9%. Some investors might consider it too low, yet I would say that this is a rather attractive level assuming the revenue multiple. On a side note, the sharp decline in the rate is due to the removal of Coterra Energy (CTRA) and Devon Energy (DVN) that were the key contributors to it in December.
Next, QVAL has ~22% ROTC, mostly thanks to Alpha Metallurgical Resources (AMR), Cal-Maine Foods (CALM), and PBF Energy (PBF). This is a reliable indication of its high quality.
Final thoughts
Growth bulls have seen a few impressive months as the style returned with a vengeance thanks to the inflation issue slowly disappearing and AI boosting risk appetite. Yet such a run might end abruptly, and it is better to be prepared. QVAL’s looks like an ETF to consider for that purpose.
Its 50 stocks-strong portfolio has a single-digit P/E and single-digit EV/EBITDA, while both EPS and EBITDA growth rates are strong. There is close to nothing to criticize on the quality side as only Liberty Energy (LBRT) has a C+ Quant Profitability rating, while other holdings are B- rated or better. The share of stocks with a B- Valuation grade is close to 56%.
Finally, QVAL has a 39 bps expense ratio, which is fairly adequate for an active strategy, while liquidity is overall fine.
Read the full article here


