Since June 1, there has been a broadening out in global stock market performance. Areas that sharply underperformed over the first five months of 2023 have caught a solid relative bid.
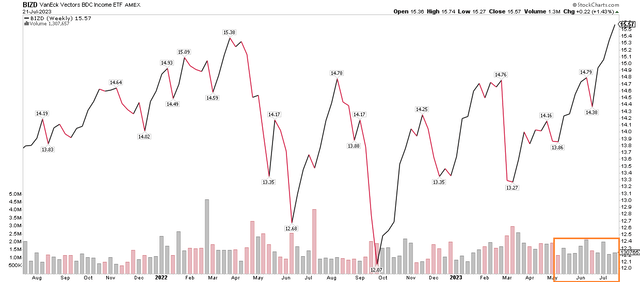
One popular high-yield equity fund, the VanEck BDC Income ETF (NYSEARCA:BIZD), is up 9 of the past 10 weeks (total return) and closed last week at fresh all-time highs when including reinvested dividends.
I have a buy rating on the fund for its objective. Let’s highlight its positive attributes and key risks.
BIZD Weekly Total Return Chart: New All-Time Highs, Up 9 of 10 Weeks
Stockcharts.com
According to the issuer, BIZD seeks to replicate as closely as possible, before fees and expenses, the price and yield performance of the MVIS US Business Development Companies (BDC) Index, which tracks the overall performance of publicly traded business development companies. The fund invests in stocks of companies operating across financials, diversified financials, capital markets, asset management and custody banks, investment company, and BDC and BDC sectors.
With net assets under management of $655 million as of July 21, 2023, BIZD features a high 10.8% trailing 12-month distribution yield and is up by more than 16% total return year-to-date. The ETF’s inception is February 2013, and over that more than 10-year track record, it has consistently delivered investors access to BDC securities that can offer attractive income. BDCs can be thought of as a proxy for private credit exposure.
The fund itself targets privately-held US companies and thinly traded U.S. public companies, which are generally difficult to own due to restrictions and liquidity constraints. For background, BDCs generate income by lending to, and investing in, private companies that tend to be below investment grade or not rated, per VanEck.
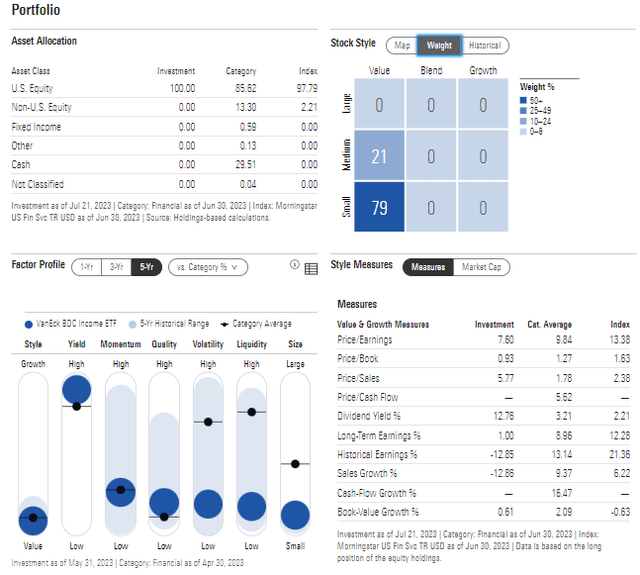
Digging into the portfolio, BIZD carries a high annual expense ratio, but more than 95% of its 10.92% stated expense ratio comes from its acquired assets. The management fee is just 0.4%, so its expenses are not all that high in my opinion. The allocation is a clear wager that the small-cap value lower-right portion of the Morningstar Style Box will outperform the broader market. I am not suggesting that BIZD will perform like a cookie-cutter index fund, but I do assert that economic sensitivity is high with the BDC corporations the fund owns, so there is a cyclical risk.
But volatility is low historically while the price-to-earnings ratio of less than 10 suggests the fund is on the cheap side and its price-to-book ratio is less than 1 (though the TTM P/E is listed at 15.7 on the VanEck page). With trading volume averaging just 338,000 shares daily and a median 30-day bid/ask spread of 7 basis points, investors should be mindful of possible light liquidity at times.
BIZD: Portfolio & Factor Profiles
Morningstar
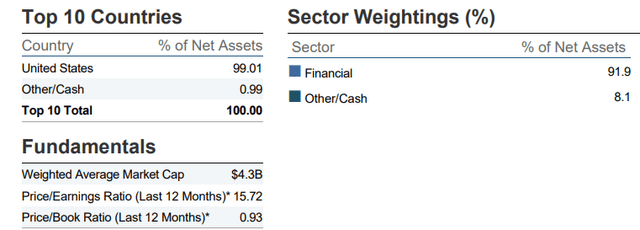
The portfolio is domestically focused while the assets it owns technically fall into the Financials sector category, but they really do not perform like the bank-heavy XLF, for instance. Another risk to consider is that the top 3 securities comprise more than half of the total allocation.
BIZD: Geographical & Sector Exposures
VanEck
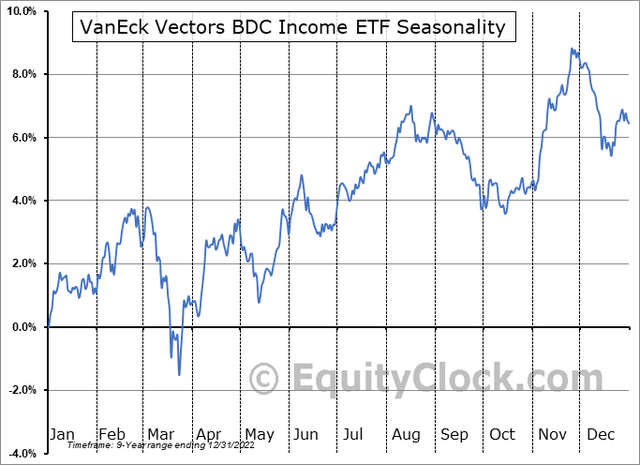
Seasonally, BIZD tends to endure a rough relative patch from mid-August through mid-October as a risk-off investing environment often comes about in Q3, according to data from Equity Clock. So, this piece of evidence suggests that a bit of caution is warranted over the coming weeks.
BIZD Seasonality: Some Weakness on the Calendar August-September
Equity Clock
The Technical Take
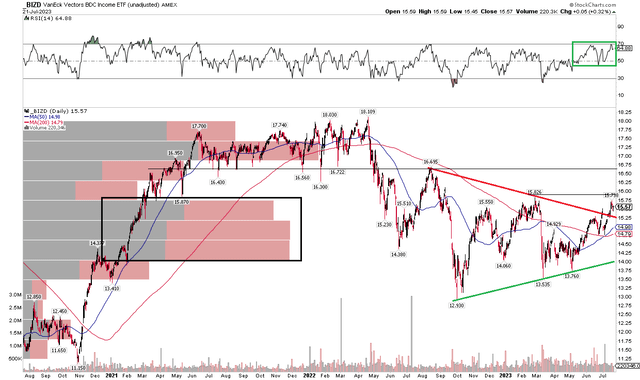
I am always somewhat hesitant to perform extensive charting analysis on high-income ETFs, since much of the total return is derived from dividends. Still, it can be useful to highlight what price points could bring about possible buying and selling pressure. While we must take it with a grain of salt, the graph below illustrates that BIZD recently broke out from a consolidation formation. A symmetrical triangle did not complete to a pronounced apex, but shares took a leg higher, nevertheless. The fund did find some near-term selling pressure at the $15.80 level – the March 2023 high.
But the technical pattern suggests an upside price target of $18.75 based on the height of the triangle ($3.25) added on top of the breakout point ($15.50). That would be a new high. Moreover, with a 200-day moving average that is now upward-sloped, the bulls appear to be in control after a downtrend that persisted from May 2022 to this past October.
Also take a look at the bullish golden cross moving average crossover that took place earlier this month. The ETF is up all but two trading days since July 5, too, so momentum is high. I see near-term support in the $14.75 to $14.80 range.
BIZD Price-Only Chart: Bullish Upside Breakout, $15.80 Resistance
Stockcharts.com
The Bottom Line
I have a buy rating on BIZD. Its construct offers investors something you do not often see, and the fee paid for the diversification of many BDCs is not too high in my view. With emerging relative strength and momentum, the time appears favorable to be long.
Read the full article here


