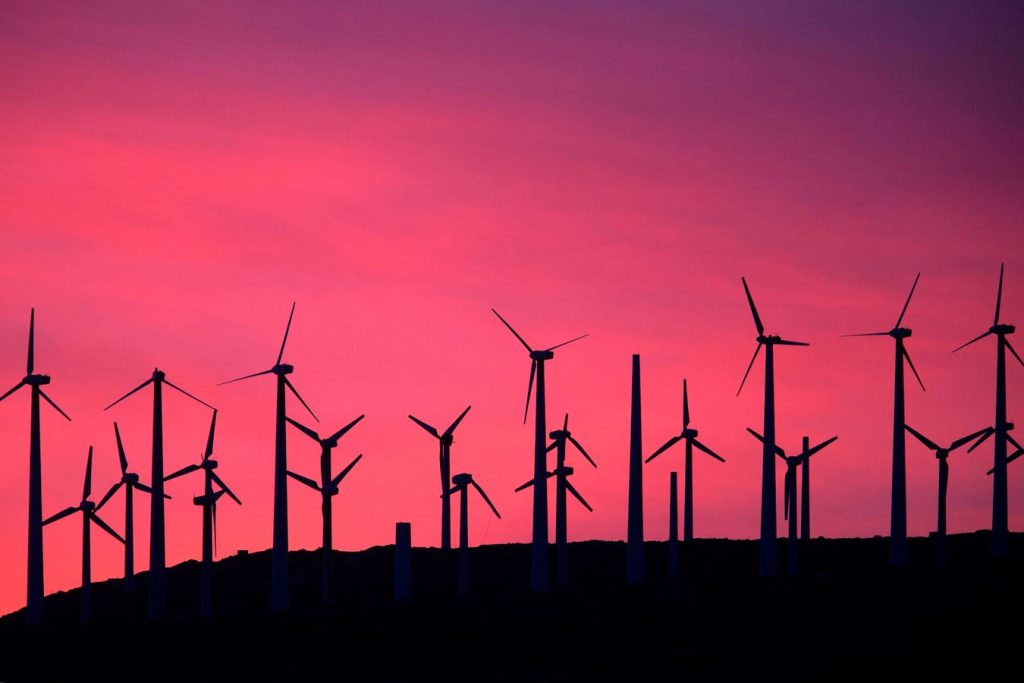
The November 13th cover of Barron’s highlighted the crash in green stocks. The cover pointed out that renewable energy equities had fallen by a third and questioned whether they could rebound. Through the application of contrary opinion and cycles, this could prove to be a low for these stocks.
Let us see what cycles indicate for this group.
The Wilder-Hill Clean Energy Index is the measure of equity performance. This group is currently ranked second from the bottom in the Cycles Research relative strength screen of S&P groups.
The daily graph demonstrates the weakness. Relative strength has recently hit a new low. Three to six months of relative outperformance is usually necessary before a sustained uptrend can begin. The monthly graph reveals that the index high was in 2008.
Clean Energy Index Daily
Clean Energy Index Monthly
The monthly histogram of expected return is based upon 23 years of data and tells us that the September through January period has been the strongest time span in any year. Price has risen over 65% of the time in that interval.
Clean Energy Index Monthly Histogram
The monthly dynamic cycle points to a low in the first quarter.
Clean Energy Index Monthly Cycle
There are two more considerations. The first is sentiment. Paul McRae Montgomery of Newport News, Va., studied 3200 covers of Time Magazine. He found that if an investment-related theme was on the cover, the value of that asset changed on average four months later and went in the opposite direction to that which Time indicated. This reversal occurred about 80% of the time.
The second consideration is relative strength. If a new low was just reached, and at least three months of relative outperformance is required to make a base for an advance, then the low may be in the first quarter.
Combining all considerations, the earliest we can expect a low is likely in March of 2024.
Read the full article here


