This article series aims at evaluating ETFs (exchange-traded funds) regarding past performance and portfolio metrics. Reviews with updated data are posted when necessary.
HDEF strategy
Xtrackers MSCI EAFE High Dividend Yield Equity ETF (NYSEARCA:HDEF) started investing operations on 8/12/2015 and tracks the MSCI EAFE High Dividend Yield Index. It has a portfolio of 124 stocks, a trailing 12-month yield of 4.57%, and a total expense ratio of 0.09%. Distributions are paid quarterly.
As described by MSCI, the underlying index starts from the developed markets benchmark MSCI EAFE Index (which excludes the U.S. and Canada) and selects stocks…
…with higher dividend income and quality characteristics than average dividend yields that are both sustainable and persistent. The index also applies quality screens and reviews 12-month past performance to omit stocks with potentially deteriorating fundamentals that could force them to cut or reduce dividends.
Moreover, the prospectus states that “portfolio management may use deliverable or non-deliverable forward (“NDF”) currency to hedge the fund’s currency exposure.” The currency hedge is evaluated on a monthly basis. Nonetheless, the prospectus lacks of transparency about the methodology: it seems the fund is not systematically hedged at all times. As of writing, no currency-related contract is listed among holdings. Additionally, the fund may hold derivatives in indexes related to the stock universe. During the most recent fiscal year, the fund’s portfolio turn-over rate was 16%.
This article will use as a benchmark the parent index MSCI EAFE Index, represented by iShares MSCI EAFE ETF (EFA).
HDEF portfolio
HDEF is mostly invested in large and mega-cap companies (about 90% of asset value). About 70% of assets is invested in Europe. The heaviest country in the portfolio is the U.K. (18.9%), followed by Switzerland (14.6%), France (14%) and Australia (12.5%). Other countries are below 9%. The next chart lists the top countries, representing an aggregate weight of 96.8%. Hong Kong is at 2.8%, so direct exposure to geopolitical and regulatory risks related to China is low.
Country allocation (chart: author; data: DWS, iShares)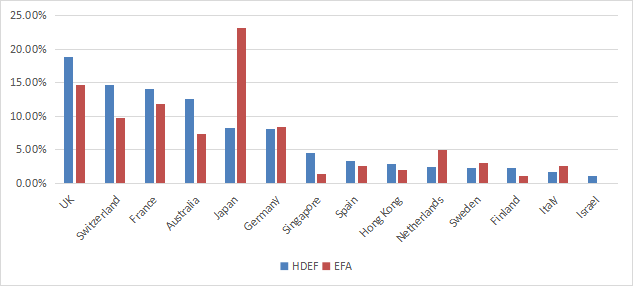
The top two sectors are financials and materials, with 22% and 18% of asset value, respectively. Consumer Staples is at 11.9% and other sectors are below 10%. Compared to the parent index, HDEF overweights materials, utilities, energy, and to a lesser extent consumer staples and financials. It almost ignores technology and underweights mostly industrials, healthcare and consumer discretionary.
Sector breakdown (chart: author; data: DWS, iShares)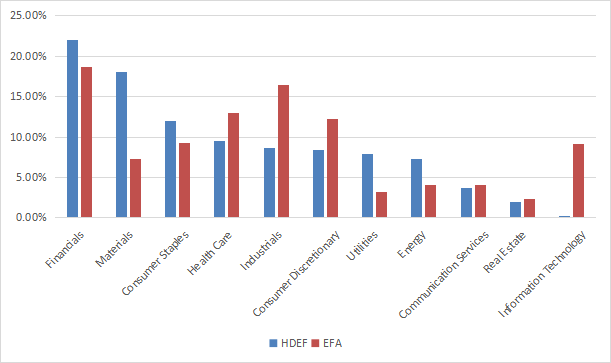
The top 10 holdings, listed below, represent 39.8% of asset value. The heaviest one weighs about 5%. The fund is quite concentrated in its top constituents, but risks related to individual stocks are moderate.
|
Name |
ISIN |
Weight % |
Country |
Sector |
|
Novartis AG-Reg |
CH0012005267 |
5.17 |
CH |
Health Care |
|
Unilever PLC |
GB00B10RZP78 |
4.93 |
GB |
Consumer Staples |
|
BHP Billiton Ltd |
AU000000BHP4 |
4.82 |
AU |
Materials |
|
TOTAL SA |
FR0000120271 |
4.53 |
FR |
Energy |
|
Allianz SE-Reg |
DE0008404005 |
4.11 |
DE |
Financials |
|
Sanofi-Aventis |
FR0000120578 |
4.09 |
FR |
Health Care |
|
Rio Tinto PLC |
GB0007188757 |
2.96 |
GB |
Materials |
|
Zurich Insurance Group AG |
CH0011075394 |
2.81 |
CH |
Financials |
|
Iberdrola SA |
ES0144580Y14 |
2.74 |
ES |
Utilities |
|
AXA SA |
FR0000120628 |
2.27 |
FR |
Financials |
HDEF is cheaper than EFA regarding valuation ratios, as reported in the next table. However, aggregate earnings growth is slightly inferior.
|
HDEF |
EFA |
|
|
Price/Earnings TTM |
11.01 |
14.15 |
|
Price/Book |
1.6 |
1.76 |
|
Price/Sales |
0.97 |
1.38 |
|
Price/Cash Flow |
6.77 |
9.8 |
|
Earnings Growth |
14.99% |
16.57% |
Source: Fidelity.
Performance
Since 9/1/2015, HDEF has lagged its parent index by 63 basis points in annualized return. The risk measured in maximum drawdown and standard deviation of monthly returns (“volatility” in the next table) is similar to the benchmark.
|
Total Return |
Annual Return |
Drawdown |
Sharpe ratio |
Volatility |
|
|
HDEF |
56.88% |
5.48% |
-36.43% |
0.33 |
15.56% |
|
EFA |
64.93% |
6.11% |
-34.19% |
0.36 |
15.76% |
Nevertheless, HDEF has outperformed in a trailing 3-year time frame, as plotted below.
HDEF vs EFA, 3-year return (Seeking Alpha)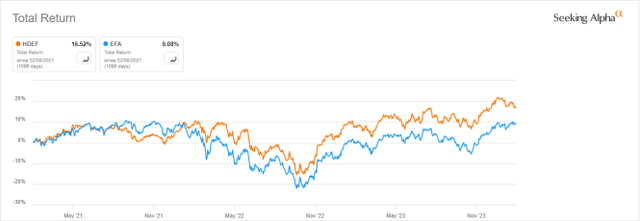
HDEF vs. competitors
The next table compares characteristics of HDEF and five of the largest international dividend ETFs using some kind of quality screening:
- Schwab Fundamental International Large Co. Index ETF (FNDF)
- WisdomTree International Hedged Quality Dividend Growth Fund (IHDG)
- Invesco International Dividend Achievers™ ETF (PID)
- Franklin International Low Volatility High Dividend Index ETF (LVHI)
- iShares International Dividend Growth ETF (IGRO).
|
HDEF |
FNDF |
IHDG |
PID |
LVHI |
IGRO |
|
|
Inception |
8/12/2015 |
8/15/2013 |
5/7/2014 |
9/15/2005 |
7/27/2016 |
5/17/2016 |
|
Expense Ratio |
0.09% |
0.25% |
0.58% |
0.53% |
0.40% |
0.15% |
|
AUM |
$1.42B |
$11.84B |
$2.12B |
$924.39M |
$693.50M |
$621.99M |
|
Avg Daily Volume |
$4.99M |
$33.78M |
$10.78M |
$3.79M |
$4.43M |
$2.31M |
|
Holdings |
143 |
943 |
261 |
51 |
149 |
437 |
|
Assets in Top 10 |
38.36% |
12.59% |
34.07% |
39.43% |
25.97% |
27.83% |
|
Turnover |
29.00% |
15.00% |
86.00% |
38.00% |
78.00% |
37.00% |
|
4 Year Average Yield |
4.65% |
3.20% |
4.91% |
3.58% |
5.79% |
2.58% |
|
Div. Growth 5 Yr (annualized) |
2.95% |
5.65% |
60.18% |
-4.36% |
10.81% |
4.26% |
Among its peers, Xtrackers MSCI EAFE High Dividend Yield Equity ETF has the cheapest fee and it is among the most concentrated in top holdings. As currency exposure may have a large impact on total return, it is important to note than IHDG and LVHI are permanently hedged, whereas the other funds are not. HDEF “may” be hedged. IHDG has an apparently stunning dividend growth rate, biased by gains on hedging positions that have been paid to shareholders in distributions.
The next chart plots total returns, starting on 8/01/2016 to match all inception dates. HDEF is the worst performer and IHDG is leading. The best-performing non-hedged fund is FNDF.
HDEF vs. Competitors since 8/1/16 (Seeking Alpha)
HDEF is in the middle of the pack over the last 12 months:
HDEF vs. Competitors, total return on the last 12 months (Seeking Alpha)
Takeaway
MSCI EAFE High Dividend Yield Equity ETF is invested in 124 international stocks with above-average dividend yield and quality characteristics. The portfolio is well-diversified across countries and sectors, but quite concentrated in its top 10 holdings. Relative to its parent index, HDEF has better valuation ratios, but inferior growth and historical performance metrics. HDEF has underperformed peers since 2016, which doesn’t make it attractive in its category despite a lower management fee.
Read the full article here
