Thesis
I am bullish on the Virtus InfraCap U.S. Preferred Stock ETF (NYSEARCA:PFFA):
- PFFA is a well-diversified and top-performing preferred stock ETF.
- The current rates backdrop is favorable for the preferred equity share class.
- Preferred stocks are trading at an attractive discount to par value.
-
I’m yet to pull the buy trigger as PFFA is trading at its 52-week high premium over NAV.
PFFA is a well-diversified and top-performing preferred stock ETF
PFFA invests in preferred securities issued by US companies with market capitalization over $100 million. Its benchmark index is the S&P US Preferred Stock Index. With 185 holdings and a max weight of only 5.05%, PFFA is a well-diversified way to get exposure to the US Preferred Stocks market:
PFFA Holding Stats (PFFA Holdings, Hunting Alpha Analysis)
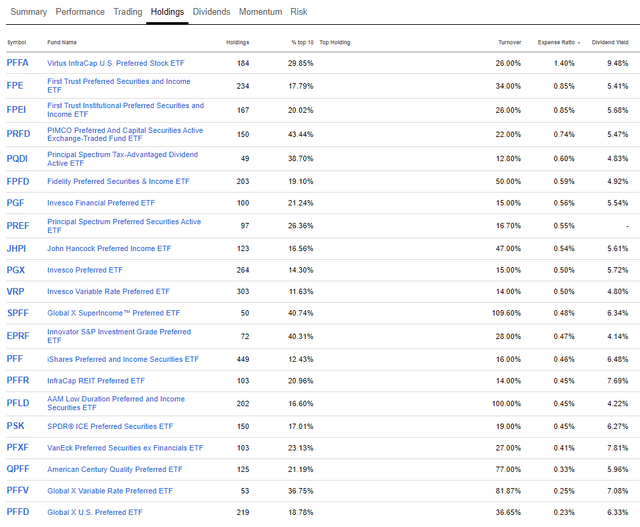
Filtering for Preferred Stock ETFs using Seeking Alpha’s ETF Screener shows 21 ETFs: (PFFA) (FPE) (FPEI) (PRFD) (PQDI) (FPFD) (PGF) (PREF) (JHPI) (PGX) (VRP) (SPFF) (EPRF) (PFF) (PFFR) (PFLD) (PSK) (PFXF) (QPFF) (PFFV) (PFFD)
Preferred Stocks ETF Comparisons (Seeking Alpha ETF Screener)
PFFA has the highest dividend yield of 9.48% among preferred stock ETFs. But as a counterpoint, it also has the highest expense ratio at 1.40%. With the higher expense ratio, investors are paying for a modest degree of active management and aggression in allocations:
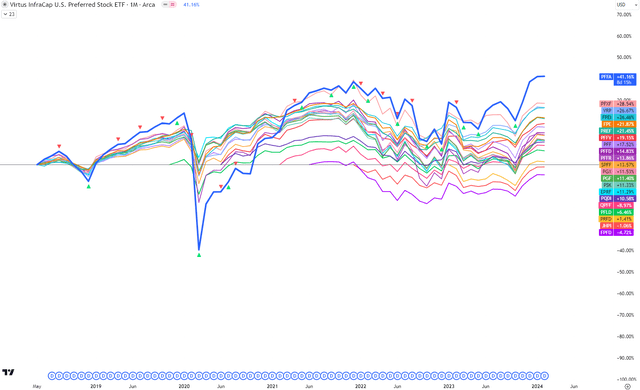
The managers of PFFA are not major benchmark-huggers. They seem to be unafraid of having large variances in their exposures vs. the benchmark. For example, by the end of Q4 FY23, PFFA had a 20.1% overweight position in real estate (27.2% allocation vs. the benchmark’s 7.1%). It also had a large 28.8% underweight allocation to financials (14.6% allocation vs. the benchmark’s 43.4%). Overall, these decisions have led to material consistent outperformance for PFFA vs. its peer group, as evidenced by the frequency at which PFFA tops the list in total shareholder return performance:
Preferred Stock ETF Total Shareholder Return Comparisons (TradingView, Hunting Alpha Analysis)
Note, however, that the more enterprising allocation style of PFFA has led to higher volatility. For example, during the COVID-induced crashes in early 2020, PFFA’s total shareholder return performance dropped sharply from the top position to the bottom position in a mere 3 months. However, over a longer period of time, it’s clear that this was a mere blip as PFFA rebounded the fastest to take the lead in performance again.
The current rates backdrop is favorable for the preferred equity share class
In Virtus ETF’s Income Investing Insights piece, it’s mentioned that:
…if history is an indicator, fixed income has an opportunity to deliver in a higher for longer [rates] period which has historically provided attractive performance.
– Hunting Alpha’s bolded highlight
This makes intuitive sense; as rates increase, the equity holders’ claims get a little bit weaker in leveraged firms. The preferred share class then seems relatively more attractive as their claims come before equity holders.
The current federal funds rate sits at 525-550bps. Although rate cuts are still expected this year, in late January 2024, the Federal Reserve indicated that it is not yet ready to implement rate cuts. In Federal Reserve Chair Jerome Powell’s own words:
We want to see more good data. It’s not that we’re looking for better data, we’re looking for a continuation of the good data we’ve been seeing.
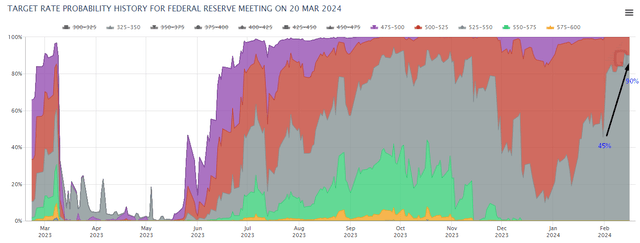
January 2024’s annual CPI print came in hotter than expected at 3.1% vs. expectations of 2.9%. I believe this is an indicator of a ‘higher for longer’ narrative to be back on the cards. Indeed, the data from the CME FedWatch probabilities supports this view as the probabilities of holding rates steady in March 2024’s meeting has increased from 45% at the end of January 2024 to 90% today:
Fed Funds Rate Decision Probabilities (CME FedWatch, Hunting Alpha Analysis)
I believe this ‘higher-for-longer’ rate environment is constructive for preferred stocks and hence PFFA.
Preferred stocks are trading at an attractive discount to par value
In the Q4 FY23 commentary, management noted that preferred stocks are trading at an attractive 14.6% discount to par value. Historically, the discount has tended to be much smaller at 0.5%. I anticipate some mean reversion to occur here, which gives another reason to be buy-biased on PFFA.
PFFA’s premium over NAV has reduced to more modest levels
PFFA NAV Premium/Discount Timeseries (PFFA Website)
PFFA’s premium over NAV stood at 52-week highs at 123.64bps at the end of 2023. The latest data as of 16 Feb 2024 shows a NAV of $20.7576/share and a market price of $20.91/share, implying a smaller premium over NAV of 73.42bps. I believe this is an acceptable level for initiating buys.
Technical Analysis
If this is your first time reading a Hunting Alpha article using Technical Analysis, you may want to read this post, which explains how and why I read the charts the way I do
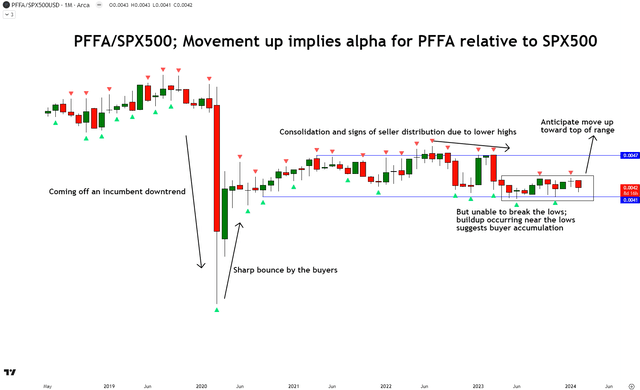
Relative Technical Analysis of PFFA vs S&P500 (TradingView, Hunting Alpha Analysis)
In the relative monthly chart of PFFA vs. the S&P500 (SPY) (SPX), I see the ratio prices have registered a sharp bounce from an incumbent downtrend. However, this bullish bounce’s progress slowed down as evidenced by a consolidation. There were also some signs of bearish pressure due to lower high progress. However, these sellers have been unable to break the lows of the consolidation range; instead, I observe a buildup occurring near the lows, suggesting buyer accumulation. Hence, I anticipate a move up toward the opt of the consolidation range, which would correspond to alpha generation for PFFA vs. the S&P500.
Key Risks and Monitorables
A key part of my bullish thesis relies on a ‘higher-for-longer’ rates narrative. Hence, the rates decisions and their respective leading indicators such as the inflation and unemployment prints are key monitorables to track the health and ongoing validity of my thesis.
Takeaway
PFFA is a well-diversified ETF providing investors exposure to the US Preferred Stocks. Compared to the broader preferred ETF universe, PFFA has the highest fees. However, I believe this is compensated by its impressive track record of consistent outperformance vs. its peer ETFs. I think this outperformance is attributable to management’s more enterprising and aggressive allocation strategy, which often varies from the S&P US Preferred Stock Index benchmark allocations by a material amount.
The data suggests that the market is pricing in a ‘higher-for-longer’ rates narrative. This is relatively constructive for the preferred share class and hence a tailwind for PFFA. As an added benefit, management noted that preferred stocks are trading at attractive discounts to par value, far below the typical levels. Also, PFFA’s premium over NAV has reduced to more modest levels from its 52-week high at the end of December 2023. Finally, the relative technical analysis of PFFA vs. the S&P500 shows some signs of buyer accumulation, suggesting alpha potential ahead.
Rating: ‘Buy’
How to interpret Hunting Alpha’s ratings:
Strong Buy: Expect the company to outperform the S&P500 on a total shareholder return basis, with higher than usual confidence
Buy: Expect the company to outperform the S&P500 on a total shareholder return basis
Neutral/hold: Expect the company to perform in line with the S&P500 on a total shareholder return basis
Sell: Expect the company to underperform the S&P500 on a total shareholder return basis
Strong Sell: Expect the company to underperform the S&P500 on a total shareholder return basis, with higher than usual confidence
The typical time horizon for my views is multiple quarters to around a year. It is not set in stone. However, I will share updates on my changes in stance in a pinned comment to this article and may also publish a new article discussing the reasons for the change in view.
Read the full article here


