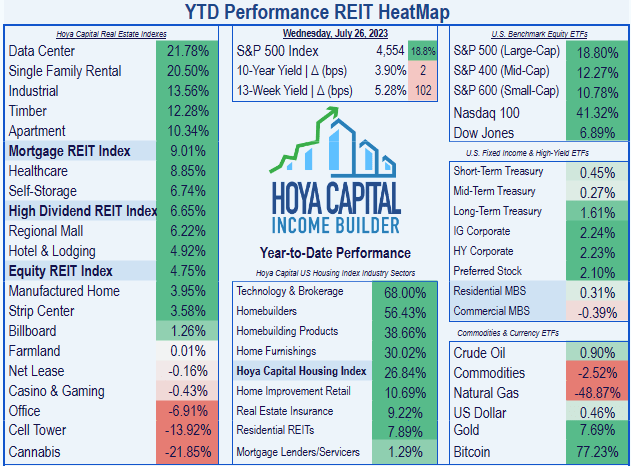
Apartment REITs as a whole have been the fifth-best performing of the 18 REIT sectors this year, nearly keeping up with the brisk pace of the S&P 400 and 600 indexes, while outperforming the Dow.
Hoya Capital Income Builder
Hoya Capital’s most recent sector report on Apartment REITs reads in part:
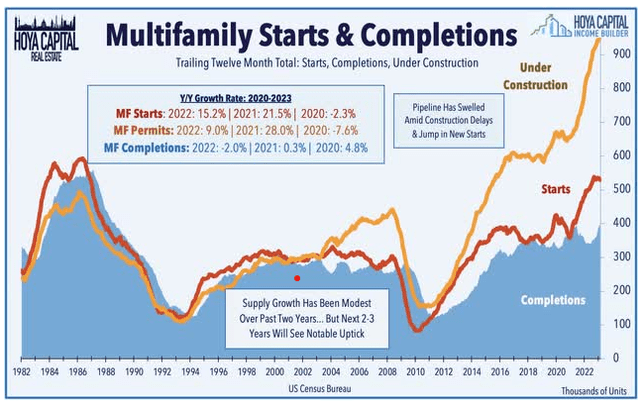
Supply concerns remain the root of … market pessimism as soaring rents sparked a wave of new development that will come to market over the next 18 months, but elongated development timelines make some often-cited pipeline metrics showing historic levels of under-construction units look more menacing than reality. . .
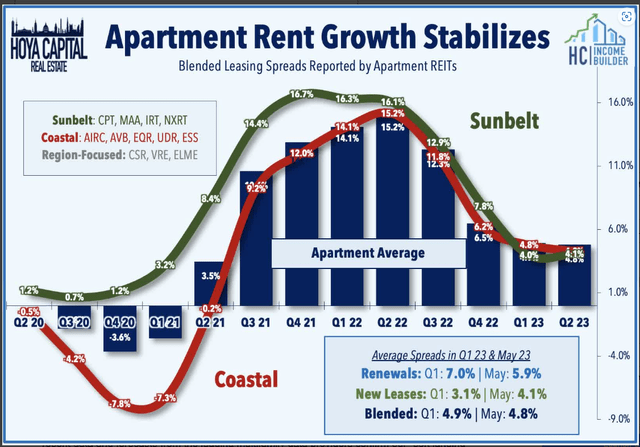
While rent growth on new leases has cooled to around 3.5% thus far in 2023, renewal spreads remained firm at above 6%. Buoyed by these firm renewal spreads, Apartment REITs expect average same-store NOI growth of nearly 7% and FFO growth of roughly 4% in 2023 – among the highest in the REIT sector.
Hoya Capital Income Builder
Soaring rents coming out of the pandemic sparked a wave of new development that will come to market over the next 18 months. However, that new supply was offset almost completely by a decline in single-family supply. Thanks to longer completion timeframes created by labor and material shortages, this increased supply will likely have a more muted effect on rents.
Hoya Capital Income Builder
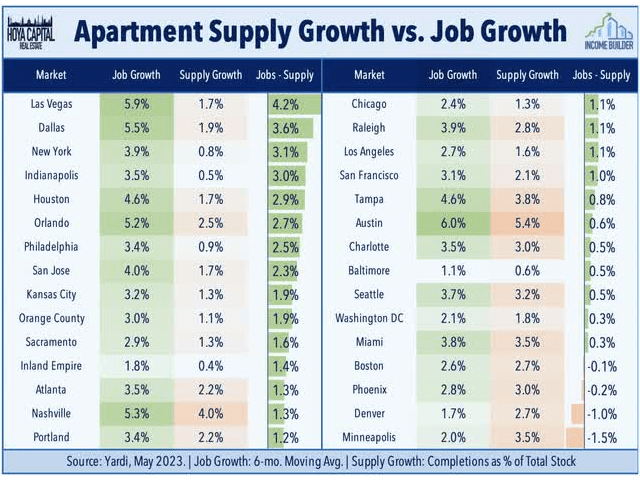
Looking more closely at the markets in which supply growth is largest, we see that for the most part, job growth in those markets is even stronger. Since job growth typically is the best predictor of apartment demand, it would appear that demand is being outstripping supply.
Hoya Capital Income Builder
Meanwhile, Freddie Mac estimates that the U.S. housing market is still more than 3 million housing units short of what’s needed to meet the country’s demand.
This article examines growth, balance sheet, dividend, and valuation metrics for small-cap BRT Apartments (NYSE:BRT), one of the smallest and most unusual of the Apartment REITs.
Meet the company
BRT Apartments
Two things set this small-cap company apart from other apartment REITs:
- Their geographic focus, which has been on the Sunbelt from the start.
-
Their preference for joint ventures, rather than go-it-alone investments.
According to the company’s website, they seek assets with 3 defining characteristics:
- Stabilized, undermanaged, or “value add” multi-family opportunities which would benefit from a capital improvement program and better hands-on management,
- Well located in areas showing positive indications of growth and which contain catalysts that promote employment and housing demand (e.g. universities, new commercial developments, airports, hospitals, and business centers), and
- In need of equity investment ranging from $2 million to $20 million.
In other words, BRT is in the business of buying older, somewhat distressed properties in high demand areas, then renovating them at high margin.
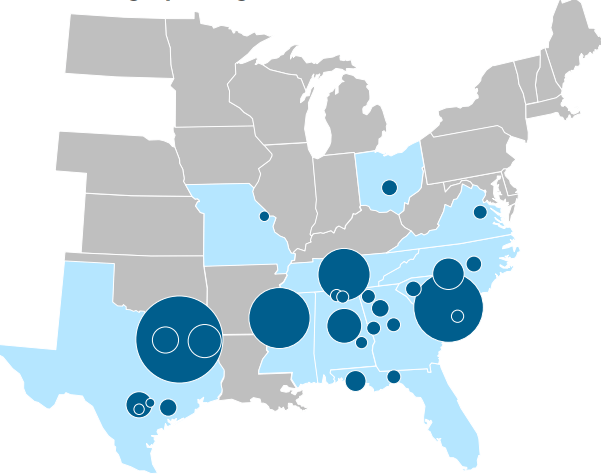
As of March 31, BRT wholly owns 21 multi-family properties totaling 5,420 units and has ownership interest in 8 more, totaling 2,781 units. These 29 properties and, 8200 units are spread across 11 states, 9 of which are in the Old Confederacy.
BRT investor presentation
The average BRT rent is currently $1215 per month, and occupancy stood at 96.2% at the start of this year.
Management has considerable skin in the game, owning 37% of shares as of this time last year.
This company prefers to acquire class B or B+ properties and upgrade them, so the average building in their portfolio is 20 years old. This company is also adept at remodeling units to increase rent, at high cap rates.
Also, they have recently begun a concerted effort to simplify their capital structure by buying out joint venture partners. This has resulted in a YoY (year-over-year) doubling of their rental revenues,

BRT 10-Q for Q1 2023
but also a near-doubling of their operating expenses.

BRT 10-Q for Q1 2023
In March, BRT acquired a 4-year-old 238-unit complex in Richmond for $62.5 million. This is a much newer building than BRT usually seeks, and could be a growth catalyst in 2024. Slightly more than half ($32 million) of the purchase price will come from a 28-year mortgage loan at a favorable 3.34% interest rate. The company expects to fully complete this transaction by year’s end.
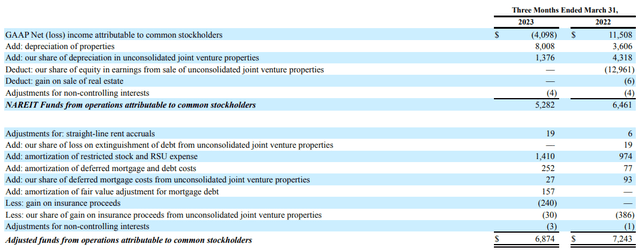
In Q1, FFO was down (-5.1)% YoY .
BRT 10-Q for Q1 2023
Meanwhile, same-store NOI (net operating income) was essentially flat, at a gain of 0.3%.

BRT 10-Q for Q1 2023
Growth metrics
Here are the 3-year growth figures for FFO (funds from operations), and TCFO (total cash from operations).
| Metric | 2019 | 2020 | 2021 | 2022 | 3-year CAGR |
| FFO (millions) | $12.0 | $17.0 | $17.4 | $23.2 | — |
| FFO Growth % | — | 41.7 | 2.4 | 33.3 | 24.6% |
| FFO per share | $0.74 | $0.99 | $0.97 | $1.24 | — |
| FFO per share growth % | — | 33.8 | (-2.0) | 27.8 | 18.8% |
| TCFO (millions) | $8.6 | $(-1.8) | $(-0.5) | $15.0 | — |
| TCFO Growth % | — | NA | NA | NA | 20.4% |
Source: TD Ameritrade, Hoya Capital Income Builder, and author calculations
Even through the pandemic, BRT achieved continued growth in FFO, though there was a slight step-back in FFO per share in 2021. Cash flow has been spotty in spite of the growth in FFO, with losses in 2020 and 2021, but BRT is coming off a banner year in 2022. It all adds up to high double-digit growth over the past 3 years. Unfortunately, that growth is not likely to continue in the near term, for reasons we will discuss below.
Meanwhile, here is how the stock price has done over the past 3 twelve-month periods, compared to the REIT average as represented by the Vanguard Real Estate ETF (VNQ).
| Metric | 2020 | 2021 | 2022 | 2023 | 3-yr CAGR |
| BRT share price July 25 | $10.29 | $17.76 | $22.86 | $19.84 | — |
| BRT share price Gain % | — | 72.6 | 28.7 | (-13.2) | 24.5% |
| VNQ share price July 25 | $78.20 | $105.85 | $94.67 | $86.27 | — |
| VNQ share price Gain % | — | 35.4 | (-10.6) | (-8.9) | 3.3% |
Source: MarketWatch.com and author calculations
BRT massively outperformed the VNQ in 2021 and was one of the few bright spots in the REIT world in 2022, before hitting a rough patch over the past 12 months. Still, if you bought shares 3 years ago, you are enjoying an annual average gain of 24.5%, compared to just 3.3% for the VNQ.
Balance sheet metrics
Here are the key balance sheet metrics. BRT has run successfully for years with Liquidity and Debt Ratios similar to this, but the Debt/EBITDA of 14.5 is concerning.
| Company | Liquidity Ratio | Debt Ratio | Debt/EBITDA | Bond Rating |
| BRT | 1.51 | 58% | 14.5 | — |
Source: Hoya Capital Income Builder, TD Ameritrade, and author calculations
As of May 1, the company was holding $13 million in cash, against debts totaling $461 million. They had no outstanding balance on their $60 million credit facility, so total liquidity is $73 million.

BRT 10-Q for Q1 2023
The weighted average interest rate on the mortgage notes is 4.02%, with a weighted average term to maturity of 7.8 years. Those notes comprise 93% of the company’s debt.
The junior subordinated notes (7% of debt) are variable rate instruments, currently costing a weighted average of 7.30%. Maturity is 13 years out, and the company has the option of paying interest only until then.
Dividend metrics
BRT never cut their dividend during the pandemic, so their 3-year dividend growth rate is not as gaudy as the REIT average. For that reason, I am using the 5-year dividend growth rate, as it presents a more realistic picture.
| Company | Div. Yield | 5-yr Div. Growth | Div. Score | Payout | Div. Safety |
| BRT | 5.05% | 3.5% | 5.60 | 80% | D- |
Source: Hoya Capital Income Builder, TD Ameritrade, Seeking Alpha Premium
Dividend Score projects the Yield three years from now, on shares bought today, assuming the Dividend Growth rate remains unchanged.
With an aggressive payout ratio of 80% and a plump current yield of 5.05%, BRT would be an excellent dividend payer, if the dividend could be considered safe. However, Seeking Alpha Premium assigns it a grade of D- for Dividend Safety, so the risk of a cut is higher than I would like, and that in turn threatens the share price. When a REIT cuts its dividend, COWhands tend to dump it like a hot potato.
Valuation metrics
From a value investor’s perspective, BRT is mildly interesting, because of its plump dividend, combined with a slightly below-average Price/FFO multiple, and appropriate discount to NAV. BRT appears to be a mild bargain, when viewed through this lens.
| Company | Div. Score | Price/FFO ’23 | Premium to NAV |
| BRT | 5.60 | 14.9 | (-17.5)% |
Source: Hoya Capital Income Builder, TD Ameritrade, and author calculations
What could go wrong?
The company’s 10-Q for Q1 contains this interesting statement:
Our operating cash flow and available cash is insufficient to fully fund the $123.4 million of [mortgage] balloon payments, and if we are unable to refinance such debt on acceptable terms, we may need to issue additional equity or dispose of properties, in each case on potentially unfavorable terms.
BRT is a little squeezed for capital over the next couple of years, which could significantly slow their growth, and adversely affect their profitability.
The company is small, and the share price is a bit more volatile than average. Because of BRT’s geographic concentration in the Old South, economic changes affecting that region could have an outsized impact on BRT’s fortunes.
Much larger Independence Realty Trust (IRT) is a competitor in the value-add apartment space, and is positioned to do very well in the near future. This competition could further impinge on BRT’s growth prospects.
Investor’s bottom line
BRT is an interesting little company with a profitable business model, but has run itself into a tight spot with balloon payments on its mortgage debt. Chances are decent it could grow itself out of this jam, but that remains very much to be seen. The company is not in trouble, but is constrained in the growth that has made it so attractive over the past several years. Meanwhile, the dividend is a bit more at risk than I would like. I rate BRT a Hold.
TipRanks, The Street, and even revisions-sensitive Zacks also rate BRT a Hold.
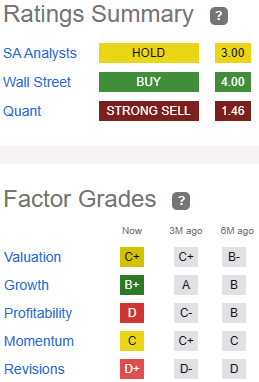
Seeking Alpha Premium
The Seeking Alpha Quant ratings system identifies BRT as a strong Sell, due to its downward revisions and its EBIT margin of (-12.9)%. It is worth noting, however, that the Quant system arrived at that unwavering Sell rating on May 17, and since that date, shares in BRT have risen 14.2%.
Meanwhile, 3 of the 4 Wall Street analysts covering BRT rate the company a Buy or Strong Buy, with none recommending selling, and the average price target is $24.67, implying 24.6% upside. Hoya Capital Income Builder considers BRT to be 5.7% undervalued.
BRT Apartments reports Q2 results after the close on August 7.
Read the full article here


