")


")
30Y US Treasury Yield is trading in a range
We can observe that the 30Y US Treasury yield is trading in a range on the weekly chart given that the Average Directional Index, or ADX, is below 20. To establish a trend over a given timeframe, ADX should be rising and above the threshold level of 25 according to the standard interpretation.
Weekly Chart US 30y Treasury Yield (StockCharts.com, 13 August, 2023)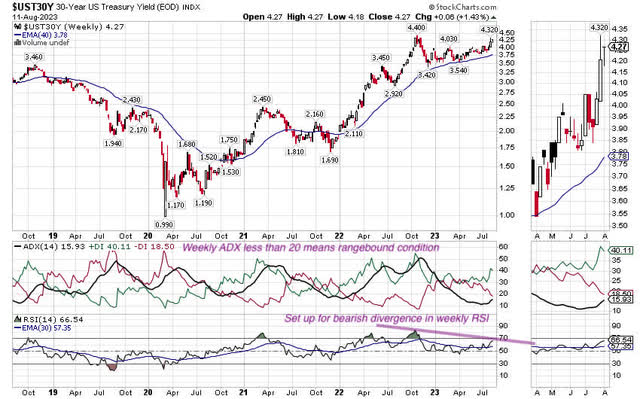
Also, the 30-year US Treasury yield is close to overbought on weekly RSI. The rangebound condition increases the significance of an overbought condition as a potential reversal point.
Of potentially greater significance is the fact that the 30-year US Treasury yield would establish a bearish divergence if it trades above the previous cycle high (i.e. 4.40%) without recording a higher high in weekly RSI. A yield of over 4.40% would make buying 30-year US Treasury bonds a compelling trade since the bearish divergence increases the odds of a sharp downward reversal in the yield.
Yield is Close to a Key Resistance Level
Since the 30Y yield is trading in a range, support and resistance levels become important levels for trading. According to the 2%x3 Point and Figure chart, the resistance level is 4.3677%. A close above 4.45% would break this resistance level.
2pct x 3 Point and Figure Chart US 30y Treasury Yield (StockCharts.com, 13 August, 2023)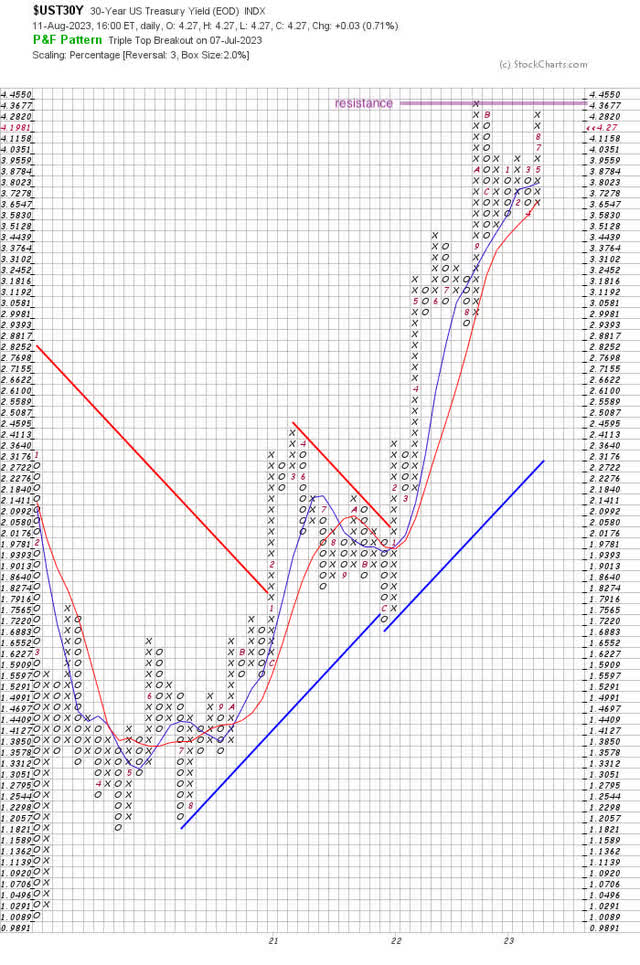
Range Condition for TLT with Support at $90
The iShares 20+ Year Treasury Bond ETF (NASDAQ:TLT) has fallen sharply since my sell recommendation on 24 January 2023. From that time, TLT retains a downward bias to price and has established a rangebound condition given the low level of its weekly ADX.
Weekly Chart TLT (5-years) (StockCharts.com, 13 August, 2023)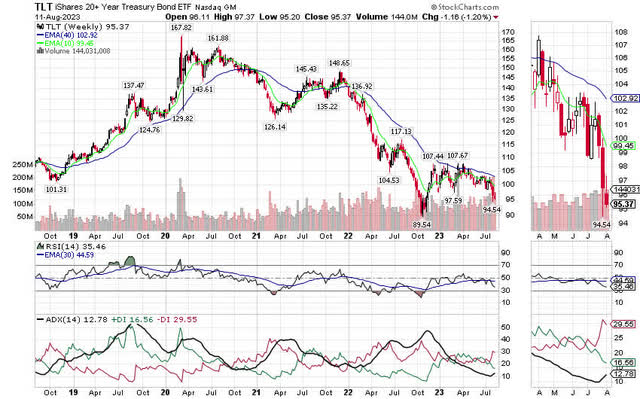
The support level for TLT is $90.381 according to the 2%x3 Point and Figure chart. This implies there is approximately -5% of downside risk to the support level from the closing price of $95.37 recorded on Friday, 11 August, 2023.
2pct x 3 Point and Figure Chart TLT (StockCharts.com, 13 August, 2023)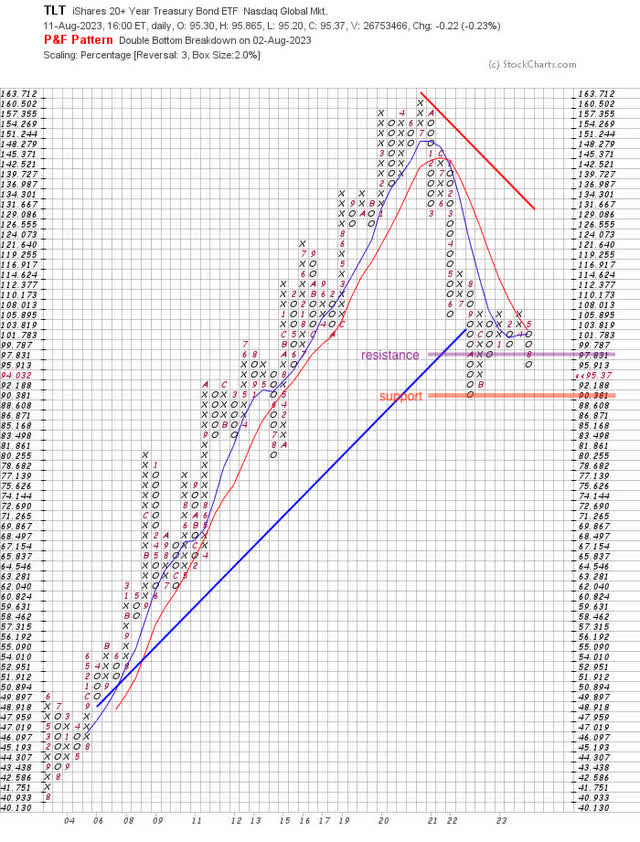
Moderating Inflationary Pressure
Long-term US treasury securities such as the ones that TLT holds are more sensitive to changes in interest rates than short-dated securities. A fixed-income security’s sensitivity to changes in interest rates is commonly referred to as duration and securities with greater sensitivity have a higher duration. Since TLT is a high-duration asset, we should consider changes in inflation expectations to time our trades in TLT.
One reliable market signal for gauging investors’ expectations for inflation is the relative strength chart of the TLT versus the Invesco DB Commodity Index Fund (DBC), which tracks 14 of the most heavily traded commodity futures contracts. Commodity prices will likely perform better relative to long-term treasury bond prices when investors are expecting inflation to rise. Conversely, we can expect commodity prices to perform worse than long-term treasury bond prices when investors are preparing for falling inflationary pressure.
Weekly Relative Strength Chart TLT vs DBC (5-years) (StockCharts.com, 13 August, 2023)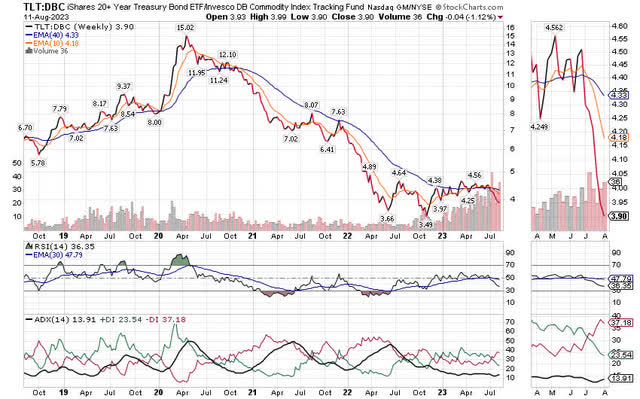
Although there is a downward bias in the weekly relative strength chart for TLT vs DBC, the overall condition is rangebound since weekly ADX is 13.91. Also, the fact that TLT vs. DBC failed to record a lower low since November 2022 reflects a moderation in investors’ expectations from that time. This corresponds with falling inflation figures captured by lagging indicators such as core PCE or measures that seek to capture inflation in real time such as the Truflation Rate.
Higher real yields present increasingly compelling value
A meaningful development that may signal that investors expect inflationary pressure to rise is that the inflation-index yield on US 30-year Constant Maturity Swaps recently broke above the October 21, 2022 high of 1.82% and closed as high as 1.96% on August 10, 2023. This implies that investors are demanding higher yields to compensate higher rates of inflation.
The insistence on higher yields amid the Federal Reserve’s ongoing quantitative tightening program was reflected in the relatively weak recent auction of longer-dated US treasury securities relative to shorter-dated ones. At the same time, real yields are presently higher than long-term averages and arguably represent compelling value for long-term investors betting on a mean reversion.
30y US Treasury CMS Inflation Indexed (St Louis Federal Reserve website, 13 August 2023)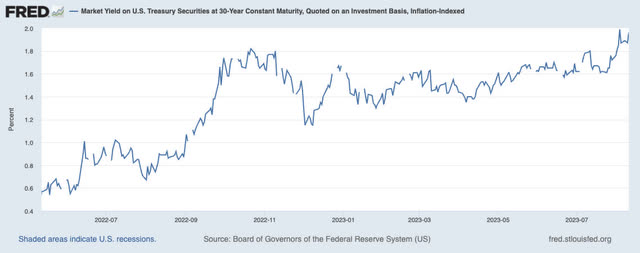
Trade set-up
Given that TLT is trading in a range and has support level at $90, investors could take advantage of a further decline in TLT with the following trade:
- Ideal buy price: $91-93
- Take-profit: $97-98
- Stop-loss: $87-88 (daily close)
- Timeframe: 5 to 35 trading days
Traders who are familiar with trading futures could consider buying the December contract of US Treasury Bond futures while traders familiar with options could consider selling out-of-the-money puts and using the premium to buy out-of-the-money calls expiring in December 2023. Traders who want another trade to potentially offset the risk of long exposure to TLT or 30-year US Bond futures could consider shorting the Invesco Nasdaq 100 ETF (QQQM) or Nasdaq 100 futures since tech stocks tend to perform badly when long-term yields rise sharply. Indeed, the relative strength chart of QQQM versus TLT was extremely overbought until recently and could be due for a sharp reversal.
Weekly Relative Strength Chart QQQM vs TLT (5-years) (StockCharts.com, 13 August, 2023)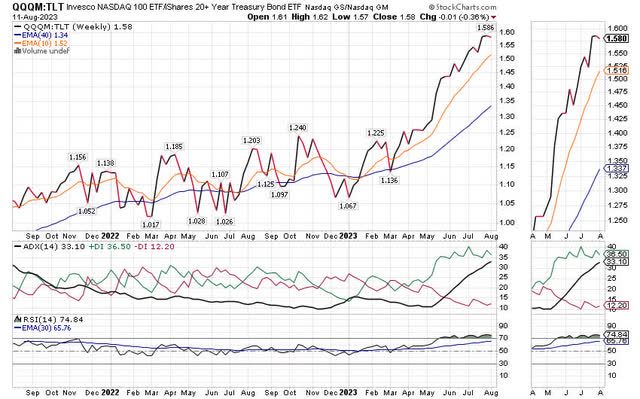
What could go wrong with buying TLT as a short-term trade?
The biggest risk to TLT is a sharp acceleration in inflation expectations along with limited, if any, response from the US Federal Reserve. Indeed, investors currently believe that the Fed is likely to maintain its policy rate in the present range since the probabilities of a further rate hike in the September and November meetings are just 11.5% and 25.7% respectively.
CME FedWatch Tool, 20 September 2023 Meeting (CME Group website, 13 August 2023)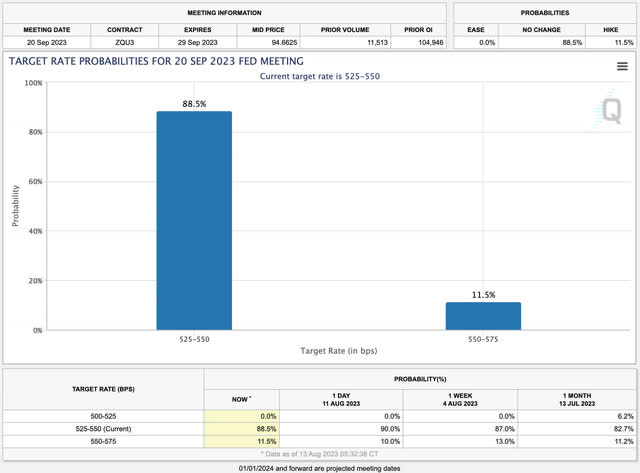
Although the Fed Fund’s Rate does not impact long-term rates directly, policy that investors perceive to be excessively loose would likely feed into inflationary pressure.
Concerns about a reacceleration in inflation could show up as a lower low in the TLT vs DBC relative strength chart while TLT breaks below its support level. It could also show up as a higher high in the 5-year, 5-year forward inflation expectations rate. The peak of the cycle so far was 2.67% recorded on April 21, 2022.
5-year 5-year Forward US Inflation Expectations (StockCharts.com, 13 August, 2023)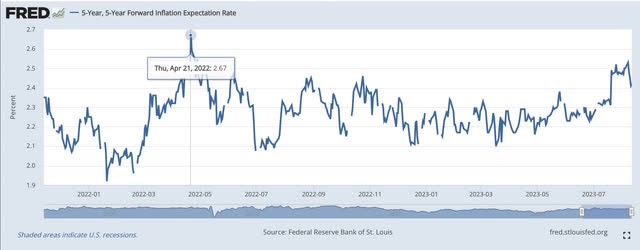
At the moment, it seems as though shorting long-dated treasuries is becoming increasingly popular given the latest Commitment of Traders data for leveraged funds. It shows that short trades have rarely been so widely held over the last five years.
CFTC COT 30y Treasuries (CME Group website, 13 August 2023)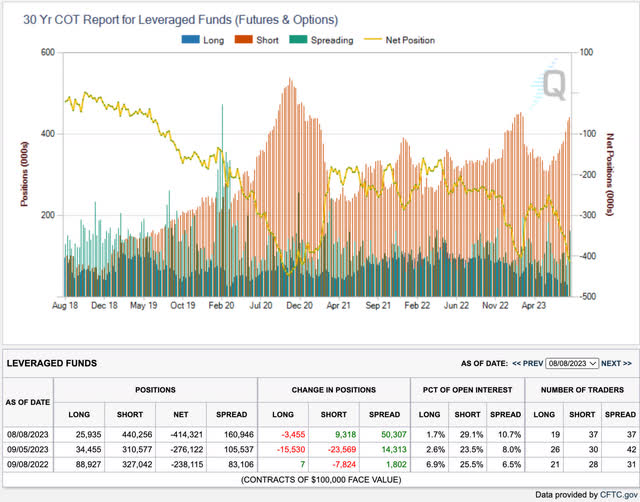
Bill Ackman’s widely reported short position against TLT and his prediction that the 30-year US treasury yield could soon rise to 5.5% is one example of a professional investor taking a negative view of long-dated treasuries. Buying TLT is therefore against the smart money consensus. This enhances the importance of timing the trade and managing risk.
Conclusions
Rising inflation expectations, weak demand in a recent auction for 30-year US treasuries and growing consensus among money managers to bet against 30-year US treasuries have helped to push TLT lower in recent weeks. However, TLT is approaching an important support level. Also, other technical indicators suggest a sharp reversal may be imminent while the highest real yield in over a decade could generate interest from large investors.
Investors seeking a compelling short-term trade could consider buying TLT below $93 and setting a target of at least $97. Given the risk of rising inflationary pressures and the fact that there is a downward bias to TLT’s price across multiple timeframes, investors should consider managing the risk of this position using a stop-loss below the current support level.
In the end, the success of this trade will depend on which risk investors focus on first: rising inflationary pressure or rising risk of recession. At the moment, there appears to be a balance between the two. Falling inflationary pressure amid rising risk of recession would be the best scenario for this trade.
Read the full article here
")
 2026-04-01")
")

")

")
")