")
Comstock Resources (NYSE:CRK) is a pure play natural gas exploration and production (E&P) company exclusively dedicated to the Haynesville shale region and 65% owned by Jerry Jones, the wealthy Cowboys owner/billionaire. He recently cashed in his preferred shares for newly minted common shares to give his investment portfolio more torque. The purpose of this writing is to determine if Comstock is a suitable investment vehicle for our modest number of Benjamins. To do that, we will look at Comstock’s break-even costs and future natural gas prices. We will try to understand where natural gas prices are headed and why. In a future article, we’ll dive into where the Haynesville shale and Comstock are ultimately headed.
Comstock Resources Basics
Let’s start with some basic facts. Comstock Resources produced 1.4 Bcfe/d (billion cubic feet equivalent per day) in 2022 and they will produce a similar amount in 2023 (although their Q2 2023 guide has this figure turning up to 1.425 to 1.55). This represents 9% of the 15.4 Bcfe/d (gross production) that the basin produced in 2022 and 9% of the 16.5 Bcfe/d the basin is expected to produce in 2023.
The basin and Comstock generate a relatively small amount of NGLs (natural gas liquids which are fractionated at a later step into purity products like ethane, butane, iso-butane and natural gasoline). These NGLs have been converted into an equivalent amount of natural gas because it is easier to keep track of them that way. Basin wide, the equivalent amount of NGLs amounted to 2.18 Bcfe/d in 2022. In dry gas terms (natural gas without the NGLs), the basin produced 13.2 Bcf/d in 2022 and 14.35 Bcf/d through May of 2023. Both the basin and Comstock are in growth mode, although with the recent rig drops, production in the near-term should level off for both.
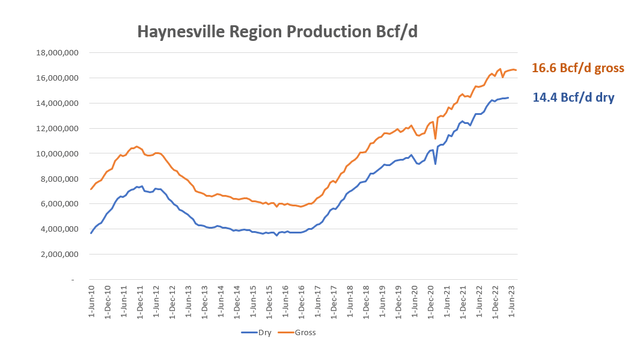
Haynesville Production (Author with data from EIA)
In 2022, with Henry Hub natural gas prices zooming to an August 2022 peak of $8.81/MMbtu, Jerry Jones and Comstock Resources had a tremendous year earning a whopping $4.11 per diluted share. That’s a stunning amount of cheddar for a stock that is currently trading at $12.22/share. The first 7 months of 2023, however, have been less than stellar, with Henry Hub monthly natural gas spot prices averaging $2.43/MMbtu, and so to borrow an OPEC term, they are “ouching.” With the boom-and-bust commodity prices giving investors a wild ride, investing in E&P companies is never easy.
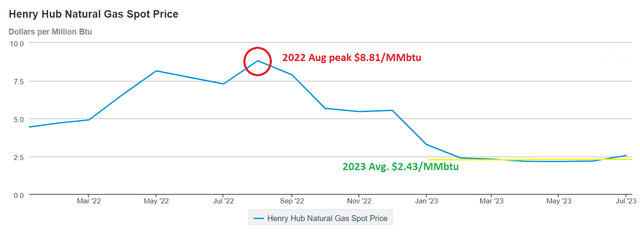
Henry Hub Monthly Natural Gas Spot Prices (EIA)
Net Production & Royalties
To understand how much they are ouching, I believe the best place to start is with break-even prices, but understanding break-even prices is not easy, especially for the notice investor so let’s unpack a few things. When a company like Comstock wants to drill a well, they lease the mineral rights from the mineral rights owner who owns the oil and gas beneath the surface and any other minerals that might be present like lithium or gold, and the mineral owners receive an amount to start and then they receive a share of the oil and gas that is produced. Like many things in life, these amounts are negotiable and go through a bidding process.
For a nice round number, let’s use 15% of the produced oil and gas revenue. For the most part, we don’t need to worry about this amount because Comstock reports net production. When we say that Comstock produced 1.4 Bcfe/d, this is net production. If Comstock pays the minerals owners 15% of production, then they actually produced 1.65 Bcfe/d (gross) and then they subtract an amount equal to the mineral owners’ share and just report their net production.
To further complicate matters, Comstock and some of their investment partners own some wells jointly and that gets tossed into their gross production with Comstock’s share coming out as net production. Net production means production Comstock owns less royalties and production due others. There are two key points to remember. If they own the wells jointly with other oil and gas investors (or E&P companies), than those investors pay for their share of drilling and completing and all the other costs that go into producing those commodities and delivering them to market. But the mineral owners don’t pay for drilling and completing costs. From Comstock’s annual report:
“Working interest” means an interest in an oil and gas lease that gives the owner of the interest the right to drill for and produce oil and gas on the leased acreage and requires the owner to pay a share of the costs of drilling and production operations. The share of production to which a working interest owner is entitled will always be smaller than the share of costs that the working interest owner is required to bear, with the balance of the production accruing to the owners of royalties. For example, the owner of a 100% working interest in a lease burdened only by a landowner’s royalty of 12.5% would be required to pay 100% of the costs of a well but would be entitled to retain 87.5% of the production.
It’s critical to understand these nuances to correctly produce the math for this next section.
Break-even Costs
With that in mind, here are Comstock’s break-even prices in 2022 and 2023 YTD based on their share of costs divided by current net production (1.4 Bcfe/d) excluding capitalized expenses. For now, we are setting aside drilling, completing, exploration and infrastructure costs. The cost per MMbtu of natural gas is $1.12 in 2022 and $1.13 through Q2 2023. The data was pulled directly from their 10-Q and 10-K reports for the corresponding periods.
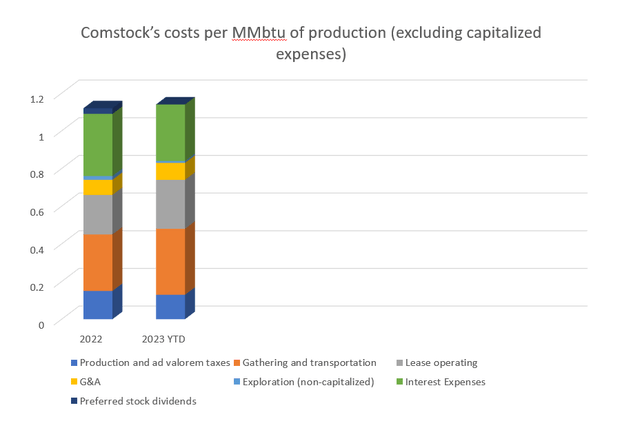
Comstock Costs per MMbtu of production (excluding capitalized expenses) (Author with data from Comstock SEC filings)
If we want to add capitalized expenses, we can simply add DD&A expenses (depreciation, depletion and amortization) to the mix and come up with the next chart. DD&A expenses per MMbtu were $0.94 in 2022 and $1.04 through Q2 2023. That brings us to all-in cost of $2.06/MMbtu in 2022 and $2.17/MMbtu in the first half of 2023.
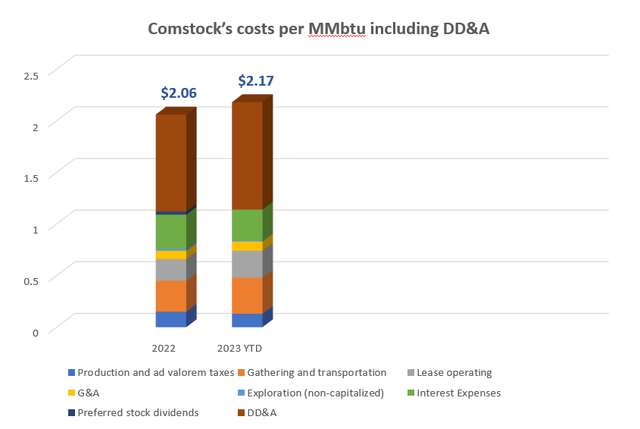
Comstock’s Costs per MMbtu including DD&A (Author with data from Comstock SEC filings)
One thing that we don’t want to do is take the $1.032 Billion in 2022 drilling, completing, exploration and infrastructure costs and divide that by the current production. In my opinion (and I think Comstock and their accountants would agree with me) – that’s not an accurate way to portray costs. Why? Because Comstock’s EUR (estimated ultimate recovery) on the 60.6 net wells they drilled in 2022 will be an average of 17.5 Bcf/well (rough number) and if you add that up, that’s 1,061 Bcf (not the 501 Bcf in production for 2022). If we divide by current production, we are grossly overestimating the costs. Plus, Comstock drilled and completed each well in a specific year (going back as far as 2008) and has a specific capitalized cost which is depleting. Comstock adds that depletion and creates a clean DD&A number. In this respect, we must trust that Comstock (and their auditors) have reported the correct DD&A figures.
Equity – Return on Investment
What we can do is add a return on the price of equity and divide that by current production. That would be 278.5MM shares multiplied by Friday’s August 4th closing price of $12.22 shares or $3,043MM in equity value. To earn a 10% return, they need to earn a realized price of $2.83/MMbtu which they cleared in Q1 but not Q2. To earn a 15% return, they need to realize $3.15/MMbtu and for a 20% return, they need to get $3.48/MMbtu.
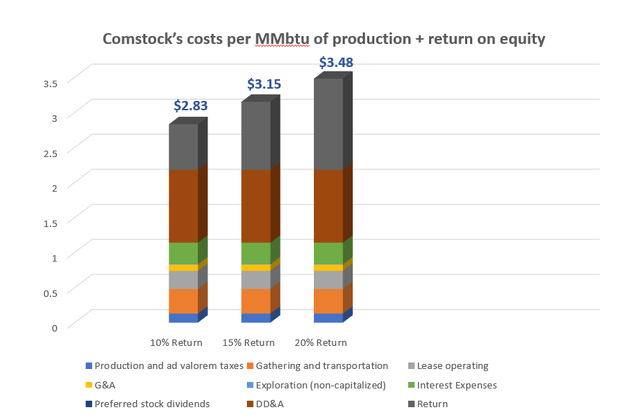
Comstock’s costs per MMbtu plus ROE (Author with data from Comstock’s SEC filings)
Based on their reported realized prices as of Q2 2023, they have now dipped below their costs and are underwater. Note: The average differential to the Nymex Settlement is negative ($0.43) over the previous 5 quarters. As the name implies a “differential” is the difference between the in-basin price (realized by Comstock) and/or the regional hub price (realized by Comstock) and the Nymex settlement. Comstock has shipping contracts on various pipelines out of the basin to prevent their differentials from blowing out.
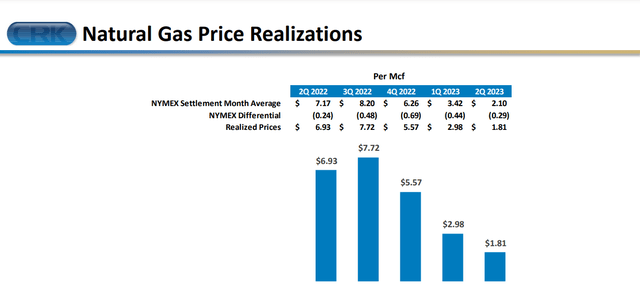
Nymex versus Comstock’s realized prices (Comstock’s Q2 Investor Presentation)
Forwards
The average realized price through 2 quarters of 2023 is $2.38/MMbtu versus an all-in cost of $2.17/MMbtu. A bet on Comstock is simply a bet that better natural gas prices are on the horizon. In my opinion, they are not in danger of running out of cash with over $1.5B in available credit and higher natural gas prices around the corner. With that in mind, let’s look at the forward curve for natural gas prices (blue line in the following figure) – these are Nymex closing prices as of August 5, 2023.
The prompt month (Sept’23) settled at $2.58 and rises to a January 2024 winter peak of $3.74 before falling back over the spring and summer. The cycle is repeated at higher prices through the winter of 25-26 before leveling out. The 12-month strip (orange line) rises steadily from $3.21 and tables out at about $4 in April of 2025. Despite the sub $3 near-term weakness in 2023, the 12-month strip never broke through the $3 price level. With rising drilling and completing and midstream transportation costs and more cautious E&P drillers – the $3 price level appears to be the new natural gas floor.
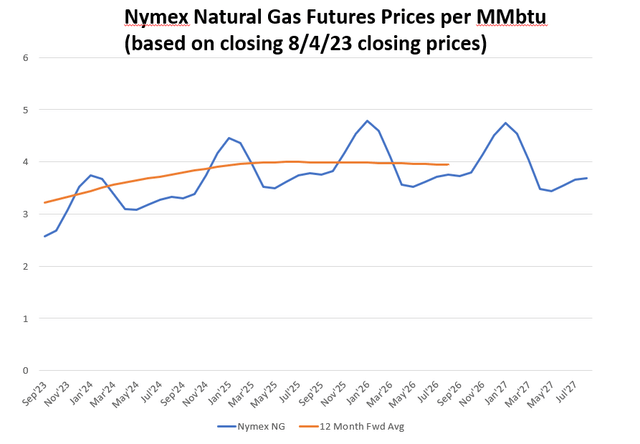
Nymex NG Futures (Nymex)
Comstock and other producers and midstream companies can hedge into these profitable prices. The rise in prices over time is really the function of lower rigs, fewer completions and higher demand expectation from new LNG facilities coming online starting in 2024. For a deeper dive on the LNG buildout and the regions lining up to serve that new demand, see Enlink Midstream: Riding The Wave of LNG Export Growth.
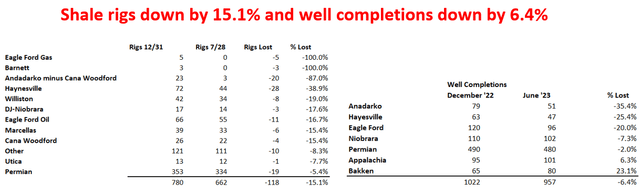
Drilling Rigs vs. Well Completions (EIA Productivity Report and Baker Hughes Rig Count)
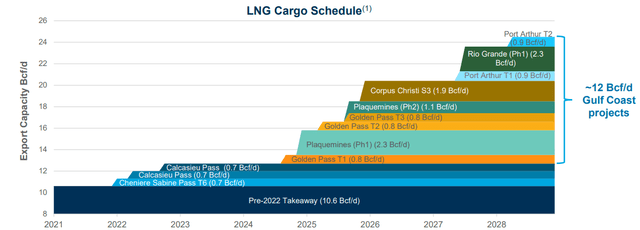
LNG FID’d Export Projects (Southwestern-Energy-August-2023-Investor-Presentation)
Conclusion & positioning
Comstock Resources is a pure play natural gas exploration and production (E&P) company exclusively dedicated to the Haynesville shale region. All in break-even prices for Comstock are running an exceptionally low $2.17 per MMbtu through the first two quarters of 2023 with realized prices coming in at $2.38 per MMbtu. The forward curve says that the $3 handle is the new floor in natural gas prices. With Comstock’s differentials to Nymex running negative ($0.42) through the first half of 2023, we are seeing near-term weakness in their margins with stronger numbers potentially in 2024 and 2025 as rigs come down and LNG facilities ramp.
For those who want to go long natural gas and play the inevitable volatility headed our way, you can go long CRK at $12ish and cash out in that $20 per share zone. Because there are other regions like the Permian who are expected to dump 3 Bcf/d of natural gas into the gulf coast natural gas market by the end of 2024 to meet the rising LNG demand, you can expect a bumpy ride. Short-term investors should have a 2-3-year time horizon to reach price targets. We will tackle whether Comstock is a suitable long-term investment in a future article where we will discuss their reserves, their exciting Western Haynesville play and the future of Haynesville production. Until then, cheers to all and happy investing.
Read the full article here

")
")
 Analyst/Investor Day Transcript")

")