It is valuable for investors to know where in the business cycle the economy is heading. When the economy is heading for recession that condition implies that a risk-off environment is likely to follow. Positioning accordingly can provide investors with the opportunity to experience alpha.
The trick is in knowing when a recession has begun. Markets are forward looking and once a recession is official that is often too late to position advantageously. For example, during the 2008 recession the recession was already halfway completed by the time it was officially declared. Shortly after declaration, equity markets bottomed as markets anticipated the recovery in advance. But that intuition wasn’t enough to keep the market from falling into the recession to begin with.
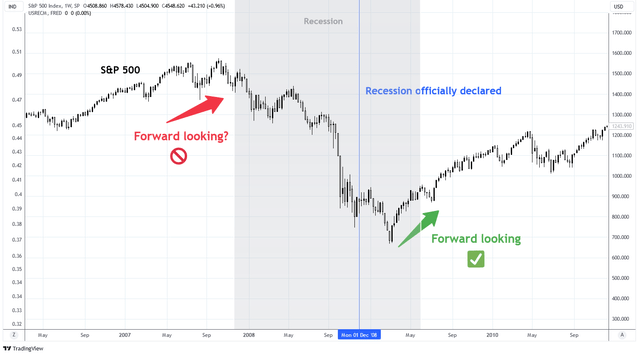
Charts by Tradingview (adapted by author)
The NBER determines the official dates of recession. Their model is based on six economic indicators which include “real personal income less transfers (PILT), nonfarm payroll employment, real personal consumption expenditures, wholesale-retail sales adjusted for price changes, employment as measured by the household survey, and industrial production.” Currently, half of the indicators are experiencing negative growth. It is very common for half of the indicators to be negative without recession.
But there’s no advantage in following the NBER indicators. We must look elsewhere for leading indicators of recession. Often investors will look at real GDP as a leading indicator. Usually real GDP is a fine indicator of recessionary trends. But real GDP by itself is not consistent. That’s why we prefer to use real GDPplus, like other savvy investors do.
Real GDP and Recession
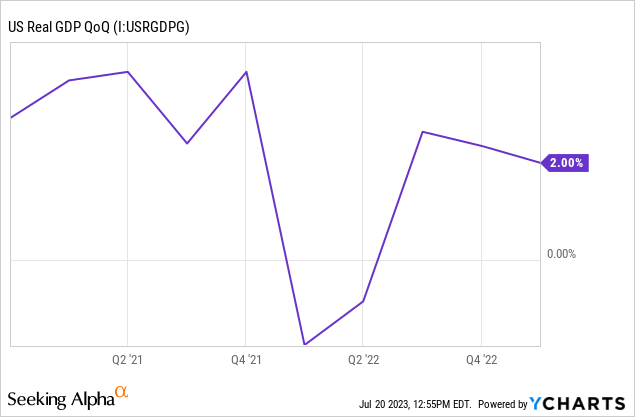
The traditional method of measuring recession involves two consecutive quarters of negative real GDP growth. But the rule is inconsistent. Some recessions occur without consecutive quarters of real GDP decline and the rule occasionally triggers without recession.
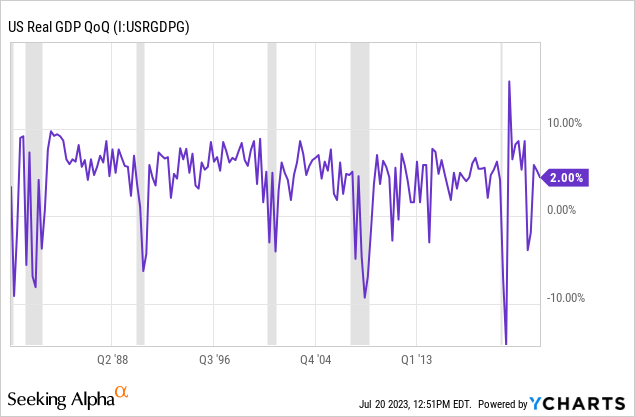
Such was the case in 1H 2022 when two consecutive measures of negative QoQ real GDP growth occurred without recession. At the time, it could not be known for sure if the NBER would later back date the recession when the rule was triggered but enough time has passed now that we know it was false.
GDP, GDI, and GDPplus
GDP is gross domestic product while GDI is gross domestic income. U.S. GDP and GDI closely measure the same economic activity in the nation and are expected to be very similar. Throughout history, this is often true but occasionally they diverge temporarily.
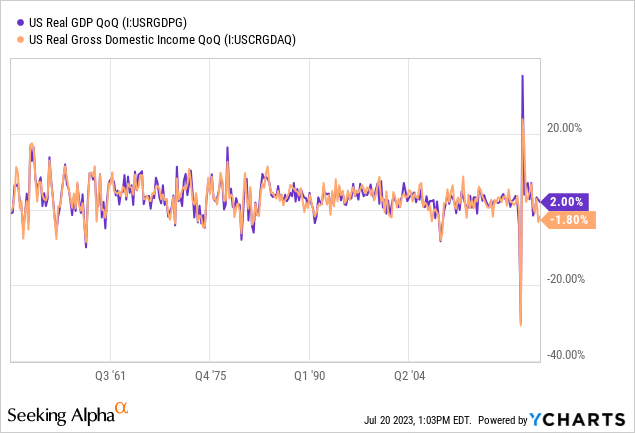
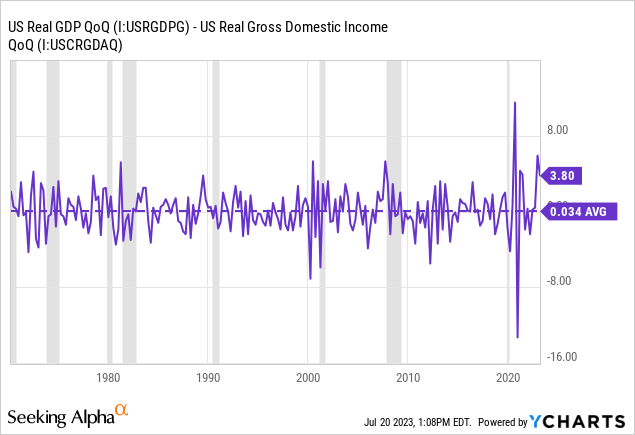
The spread between real GDP and real GDI averages close to zero. There are periods of time, however, that the spread experiences volatility. Spread volatility tends to increase as the economy approaches recession. The most significant exception was the recession of 2020 which occurred so quickly that spread volatility transpired in the aftermath. Today, the spread is near the upper bound at 3.8. This means that real GDP QoQ is 380 basis points higher than real GDI QoQ.
Related to this volatility, the Federal Reserve Bank of Philadelphia published WORKING PAPER NO. 13-16 IMPROVING GDP MEASUREMENT: A MEASUREMENT-ERROR PERSPECTIVE that identifies “noise” in GDP data that negatively impacts the predictive value of the data. The authors argue that using GDP or GDI exclusively is problematic because GDP is a measure of economy expenditures and GDI is a measure of economic revenues. The paper proposes a new measure of economic activity that considers both expenditures and revenues and removes “noise” in the data from measurement errors. The product is a measure that is more consistent and better measures economic fluctuations.
Based on this new methodology, the Federal Reserve Bank of Philadelphia introduced its new model called GDPplus. GDPplus considers both GDP and GDI in a statistically optimized way. The GDPplus model helps to moderate the impact of GDP/GDI volatility.
Below is the history of the GDPplus model and recession. Once, in Q3 2012, since 1960 did the model produce a false negative. In that instance the model was -0.1% for one quarter before rebounding strongly to 2.9%. The model produced a negative growth statistic in Q4 2019 while GDP and GDI remained positive, suggesting that the U.S. was heading to recession before the pandemic. In Q3 and Q4 2007, GDPplus recorded two consecutive negative quarters leading up the start of the Great Recession in December 2007 while neither real GDP or real GDI had two consecutive quarters of negative growth at the time.
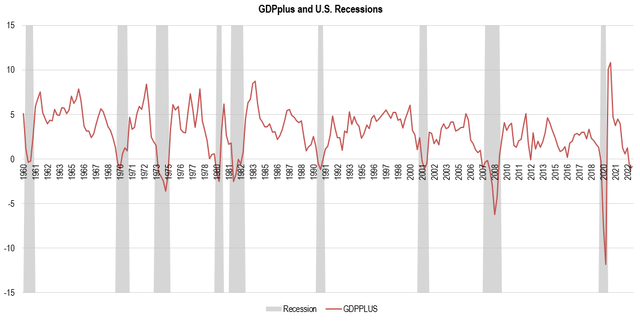
Chart by author (data from the Federal Reserve Bank of Philadelphia)
GDPplus has now recorded two consecutive quarters of negative growth with -1.2% in Q4 2022 and -0.8% in Q1 2023. If this were to be a false signal of recession, it would be the first time that consecutive negative quarters were a false signal in the model’s history.
Conclusion
Declaring a recession is not a straightforward exercise. Many points of data must be considered and there is no one point of data that must be present. This is why the NBER uses an aggregate of data in their methodology.
It’s not good enough to follow the NBER data. By the time NBER indicators have identified recession, the market will have priced in the reality. Instead, those that wish to anticipate recession must use an aggregate of data with superior forecasting ability. The potential for recession cannot be known with certainty but with a preponderance of evidence the probability of recession can be properly assessed. GDPplus is a critical part of that preponderance of evidence which is strongly supporting the view that probability of recession is significant.
Read the full article here


