")
")
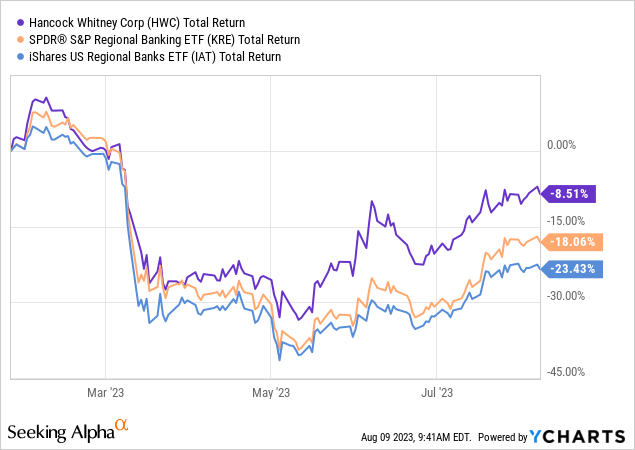
Regional banks have gone through a fair bit of turmoil since my last Buy-rated piece on Hancock Whitney (NASDAQ:HWC) back in January. At the time, I said that Hancock might be in a relatively more attractive position given both its funding position and moderate valuation, and although these shares have fallen 8-9% on a total return basis since then, outperformance versus the peer group does at least provide something positive to cling to.
Higher funding costs, moderating loan growth and cost inflation were chief concerns even back then, and events since have only served to increase the income statement headwinds facing the industry. Earnings outlooks have been walked down across the board as a result, and Hancock is unfortunately no exception. The hard reality is that this bank will be generating materially lower net income versus what was anticipated six months back.
While forward EPS projections are now lower here, Hancock would still be on for a solid double-digit return on tangible equity (“ROTE”) as things stand. These shares still look intrinsically cheap to me, and with that I retain my Buy rating, but that comes with the caveat that positive near-term catalysts are not exactly plentiful right now.
NII Walked Down On Higher Funding Costs
Higher interest rates and fears surrounding the health of the industry following a number of bank failures earlier in the year have sent funding costs up sharply. Hancock possesses a strong core deposit franchise, but it isn’t immune to what is ultimately a severe industry-wide headwind right now.
Non-interest bearing deposit balances have fallen by around $1.5B (~11%) since the start of the year, taking their share of the overall deposit mix from near 50% to 40%. Core deposits have fallen by around $1B (~3%) on the same basis. While total deposits are actually up 3% over this period to around $30B, that has largely come from more expensive retail and brokered time deposits, of which Hancock has added around $3B since the end of 2022.
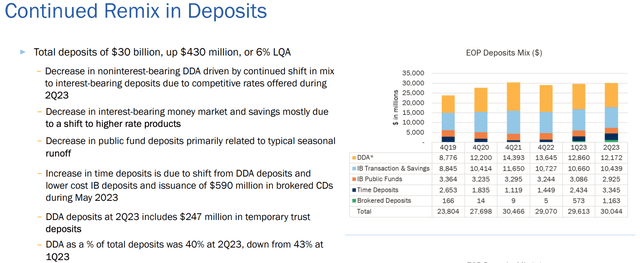
Source: Hancock Whitney 2Q23 Results Presentation
That has sent the cost of its interest-bearing liabilities up around 145bps in that time, with total cost of funds up 95bps since year-end to 1.57% in Q2. Although loan yields are also repricing upward, Q2 net interest margin of 330bps was down 25bps sequentially and 38bps on Q4 2022. Management expects NIB deposit balances to decline around 35% of the total over the rest of the year, with NIM declining another 10-15bps on the same basis.
The upshot of the above is that net interest income (“NII”) projections have been significantly walked down since last time out. Back then, FY23 pre-provision operating profit (“PPOP”) guidance implied a shade under $1.2B in annual NII. That has since been lowered some 10% to circa $1.08B as things stand. This would still be good for low single-digit year-on-year growth, but given the soft comps in H1 it does imply materially weaker year-on-year performance in H2.
What’s more, guidance on full-year fee income (now seen 1-2% higher) and operating expenses (seen 8% higher at the mid-point) have also moved in the wrong direction. As a result, FY23 PPOP is now seen around 2% lower year-on-year versus initial expectations of strong double-digit growth.
Asset Quality Remains Very Strong
Asset quality has remained a positive thus far but presents a bit of a wild card going forward. Owing to the pace of rate hikes, the health of the commercial real estate space has come under particular scrutiny recently, and regional banks with large CRE exposures are coming under pressure. Traditional office lending looks particularly vulnerable given work-from-home trends. Non-owner occupied CRE does represent around 15% of the book here (~1.4x tangible common equity), while construction loans are another 8% or so (~0.65x TCE). Traditional office exposure is fairly limited though, standing at less than 2.5% of total loans.
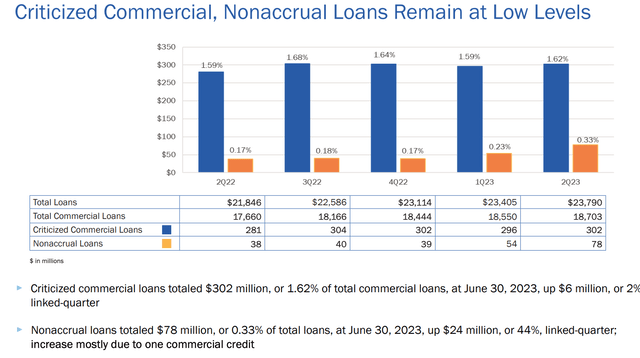
Source: Hancock Whitney 2Q23 Results Presentation
As for current asset quality, criticized commercial loans stood at 1.62% of total commercial loans, a slight rise sequentially but flat on the start of the year. That is also still down materially versus pre-COVID levels, when it was above 2% for the non-energy commercial part of the book. Non-accrual loans did tick up 10bps sequentially but again some perspective is required here. At around 0.33% of total loans they remain well below comparable period pre-COVID levels of circa 1%. The loan loss allowance (~1.45%) also remains around 45bps above 2019 levels.
With that, my outlook for FY23 provisioning expenses hasn’t increased all that much, but versus last year’s release is worth another 10-11% in terms of year-on-year EPS decline. That gets us to the $5.20 or so that analysts expect for this year, though I do think the chance of underperformance there is greater than outperformance.
Shares Look Like A Good Value, But Lack Near-Term Drivers
At $43.54 Hancock stock trades for around 8.4x consensus FY23 EPS, rising to 9.3x on the current FY24 consensus. As a multiple of tangible book value (“TBV”) the stock is currently at 1.4x the Q2 figure, which is down from around 1.7x last time out.
Hancock Whitney: Five-Year Price To Tangible Book Value Multiple
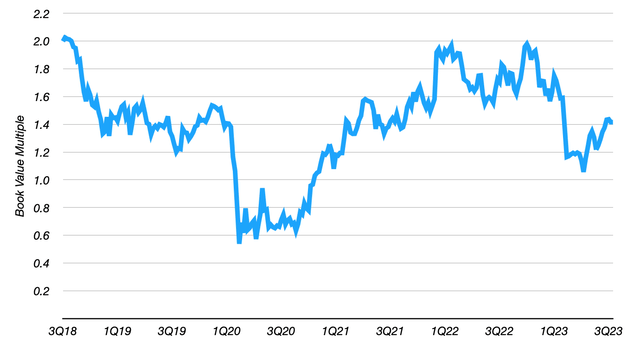
Data Source: Hancock Whitney Forms 10-K
Previously I argued that around 2x was fairer for Hancock given its solid double-digit ROTE profile. Although consensus FY23 EPS still maps to a circa 17% ROTE, falling to around 14% based on the (very tentative) FY24 EPS estimate, my mid-term profitability forecasts are lower now given developments in the interim. I now only see an average ROTE of around 15% over the next five years. I’m lowering my TBV-based fair value estimate to 1.7x as a result, which points to a fair value in the $52-$53 per share area, or 20% above the prevailing price.
While the above does point to decent upside here, near-term drivers to realizing that look thin on the ground given the risk of further downward revisions to EPS estimates. With earnings set to show year-on-year declines in FY23 and FY24, realizing value looks more of a medium-term story here.
Read the full article here

")

")
")
 Analyst/Investor Day Transcript")

")