2026-04-01")

")

The US Dollar Index settled last week at its highest mark since early July. That has key macro implications. For one thing, it often means a move lower in commodities, but that has not been the case this time around.
Rather, as the greenback nears its highs for the second half, the price of prompt month WTI crude oil has been up in each week of the quarter so far. Now, higher energy prices usually means an outperformance of resource-heavy regions, such as Latin America. But the dollar has proved to be more impactful to the iShares Latin America 40 ETF (NYSEARCA:ILF) lately.
I am reiterating my hold rating on ILF given an uncertain macro backdrop though the fund has certain attractive features, including exposure to established companies in Latin America, a trailing 12-month dividend yield of over 8.6%, and a low forward P/E ratio.
A Dollar Rise Is Often Bearish For Latin America Stocks
TradingView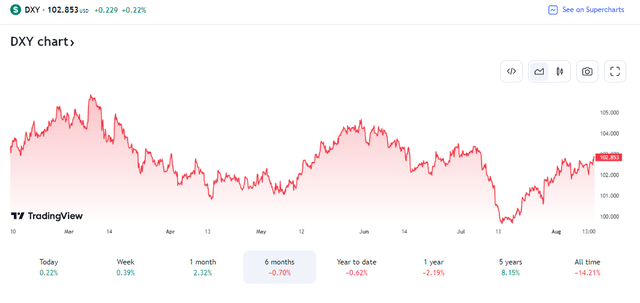
Since my last look at the ETF, ILF has performed fairly well. The below 6-month ETF performance heat map illustrates that ILF is among the best regional funds, up more than 11% – particularly strong versus many other non-US countries.
6-Month ETF Performance Heat Map: ILF Sports Solid Total Returns
Finviz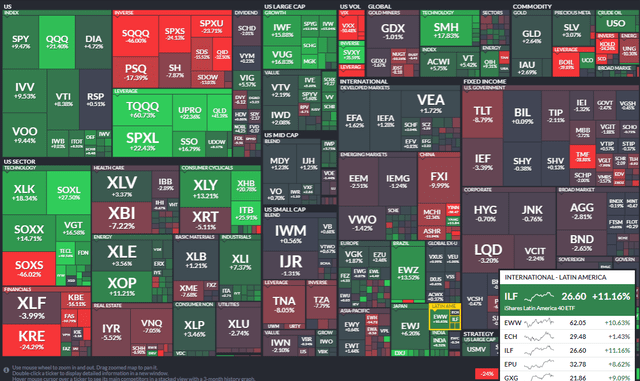
For background, ILF is managed by BlackRock, and it focuses on investing in the public equity markets of Latin America and the Caribbean. The fund targets growth and value stocks of large-cap companies across various sectors and it aims to track the performance of the S&P Latin America 40 index, which consists of the 40 largest Latin American equities. The fund was established on October 25, 2001, and is based in the US. It generally invests at least 80% of its assets in securities that closely mirror the index’s components.
ILF features a high dividend yield of nearly 9% as of August 11, 2023, though that is a look-back percentage, and ILF has a history of widely fluctuating payouts. Still, the fund’s distribution rate has increased sharply in the last two years, as evidenced by the chart below.
ILF: Dividend Growth Is Strong
Seeking Alpha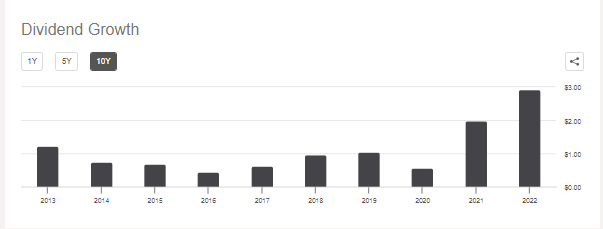
ILF is an established fund with more than $1.4 billion in assets under management and a typical daily volume of more than one million shares. Liquidity is indeed robust considering the fund’s 30-day median bid/ask spread is just four basis points. A key risk, though, is that ILF is not very diversified as it holds just 41 total positions, per iShares. Its expense ratio is moderate at 0.48%.
What’s more, while the S&P 500’s standard deviation has been low lately, ILF swings around with more violence, on average. The bulls, however, can point to the portfolio’s low 4.9 forward P/E ratio as a reason to buy. Morningstar notes that its trailing P/E is higher, though still cheap, at 8.3. On the style box, ILF is almost strictly a large-cap fund – just 3% of the allocation is considered mid-cap. There is also a value bent to ILF with just 15% in the growth category.
ILF: Portfolio & Factor Profiles
Morningstar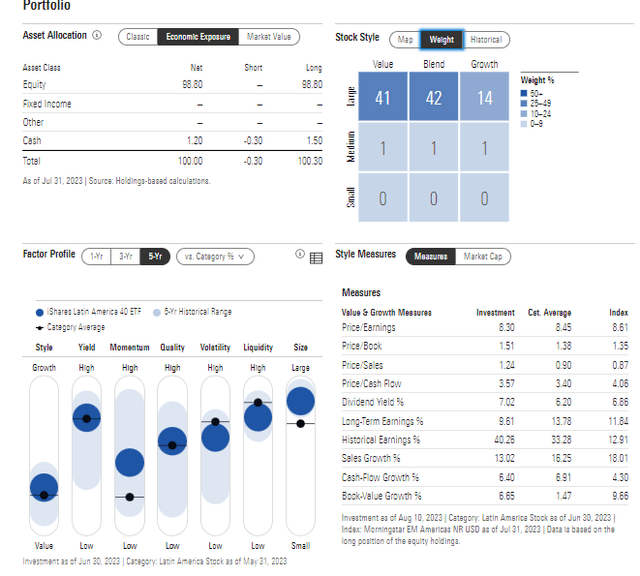
Investors must recognize that ILF features a significant concentration in its top 10 holdings. With Vale (VALE) at a more than 10% weight, more than half the fund’s total assets are in the top 10 stocks. ILF will also move quite a bit differently compared to the S&P 500 thanks to its sector breakdown.
Nearly one-third of the ETF is in the Financials sector and there is no exposure to the growth-heavy Information Technology area – the largest sector in the SPX. As a result, while ILF is volatile, it can actually offer some portfolio diversification benefits as its beta to the S&P 500 is just 0.65 over the past 24 months, per Seeking Alpha.
ILF Portfolio: Value, Cyclical-Heavy, Light on Growth
Seeking Alpha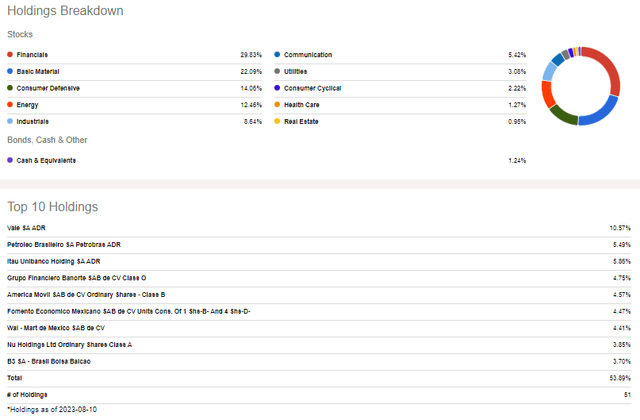
Seasonally, now is an opportunistic time to be overweight ILF, according to calendar trend data provided by Equity Clock. Late August through mid-January has historically been a strong period.
ILF Seasonality: Bullish Mid-August-December
Equity Clock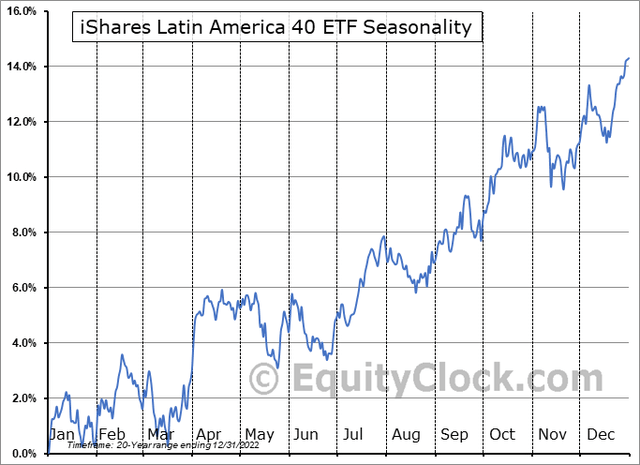
The Technical Take
While I continue to like ILF’s valuation and with positive seasonal trends taking hold, the technical situation remains lackluster. Notice in the chart below that the fund continues to consolidate with lower highs and higher lows. With this long-term perspective compared to my previous outlook on ILF, we can better see what to watch for technically. I see resistance in the mid-$30s. Now, you might think that there are several possible areas of future selling, but that is an important level in my view because there’s a high amount of volume by price from the current area up to about $35.
Hence, once ILF clears that zone, then there’s much less bearish overhead supply to work through. On the downside, the $23 to $24 range should hold – if we lose that then I would be on the lookout for a move to the $20 to $21 area – that is also where a heavy amount of volume was seen in a pullback during the first half of last year. The good news is that the weekly RSI momentum indicator at the top of the chart has been trending better lately, though its long-term 200-week moving average is negatively sloped.
Overall, there are mixed signals, but I would give the nod to the bears today.
ILF: The Consolidation Continues, Bullish RSI Trend, $35 Long-Term Resistance
Stockcharts.com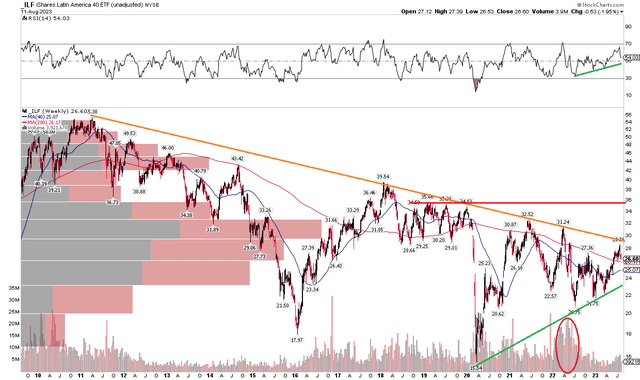
The Bottom Line
Despite a steep rally in crude oil prices this quarter, ILF has underperformed the S&P 500. Still, the fund’s absolute total return has been solid over the past six months. With a low earnings multiple and slightly bearish chart, I reiterate my hold rating but recognize bullish seasonal potential.
Read the full article here
 2026-04-01")
")

")

")
")