")
Thesis
Mid-cap ETFs have somewhat fallen out of fashion as the majority of market participants are almost exclusively focused on well-performing large-cap names and/or up-and-coming growth names, especially within the information technology space for the past years. While large-caps have undoubtedly outperformed over the past decade or so, the size factor, reviewed in this analysis, is bound to bring attractive return performance to mid-caps, likely in the near term.
Vanguard’s S&P Mid-Cap 400 Index Fund ETF (NYSEARCA:IVOO) offers investors exactly that desirable, diversified mid-cap exposure, and in this analysis the fund’s attributes and risk/return performance are also examined.
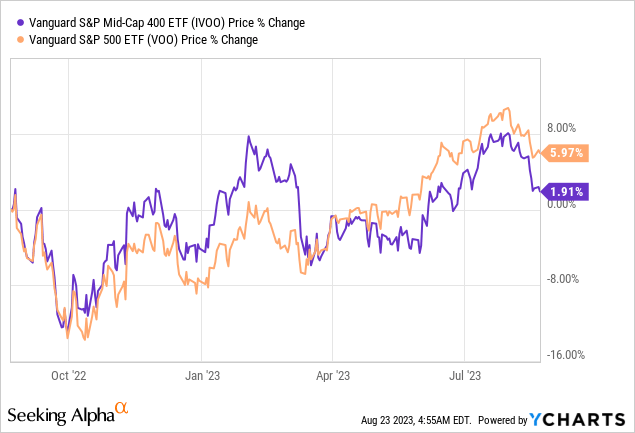
Over the trailing 12 months, the stock market has shown strong recovery signs, followed by some turmoil over the past few weeks indicating a possible pullback. Even though mid-caps recorded strong relative performance in late 2022 and early 2023, as of mid-August they have returned to underperforming the S&P 500. For the TTM the S&P 500 has returned 5.97%, compared to IVOO’s 1.91%.
Size Effect and Mid-cap Outlook Going Forward
In the public equities universe, research has observed that over the years smaller firms tend to offer, on average, higher returns than large caps. The size factor, as it is often called, introduces investors to more growth exposure, as smaller companies tend to grow faster compared to their large-cap counterparts. Of course, the size factor also introduces additional risk for investors, as smaller firms are by default less established and therefore more risky (in terms of liquidity, capital structure, etc.).
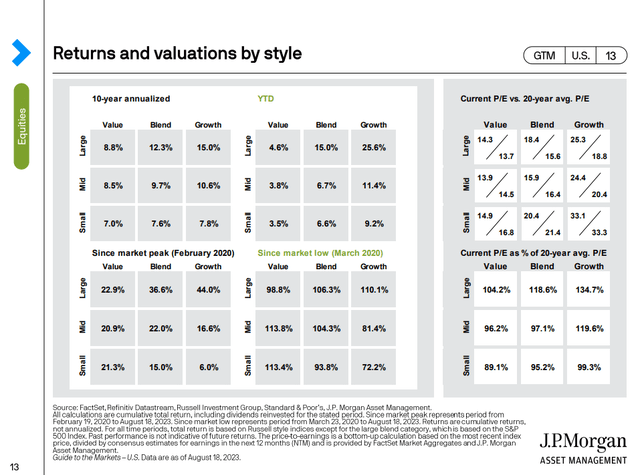
While the size factor has offered positive excess returns historically, over the past decade stock market performance tells a completely different story. Blend Mid-caps have returned 9.7% annualized, compared to blend large caps, returning an impressive 12.3% annualized. This performance gap is also evident in the Value and Growth Factors as well, and has substantially widen since the Covid-19 spread in 2020 and over the past year as well. The market has been increasingly concentrated with mega-cap technology names like Apple (AAPL), Microsoft (MSFT) and others, dominating in terms of performance.
While many analysts seem to believe that mega-cap domination will be the norm for the foreseeable future, in my view, expectation of a reversion to historical trends is also very logical. In a scenario like that mid-cap (and small-cap) equities are bound to outperform in the mid-term.
J.P. Morgan
In addition to an expected trend reversal in favor of mid-caps in the near term, investors can also substantially benefit from their relative valuation attractiveness at this moment. Unlike large-caps, mid-cap equities currently trade underpriced compared to historical P/E valuation averages. More specifically, mid-caps trade at a 15.3x P/E compared to their 16.4x average 20-year multiple. In the current, expensively priced stock market, finding attractively valued equities might prove lucrative.
Fund Profile
Incepted in September 2010, The Vanguard S&P 400 ETF is one of the smaller blend mid-cap ETFs available for investors with just $1.6B of Assets Under Management. IVOO provides investors with exposure toward a wide range of medium size U.S equities by tracking the S&P MidCap 400 Index. In terms of risk exposure, IVOO is relatively more aggressive compared to a large-cap fund, yet it is well diversified across sectors and company maturity profiles. The ETF charges a relatively low 0.10% and currently pays a 1.5% dividend yield, slightly higher than the S&P 500 average.
On February 22, 2023, Vanguard announced that the ETF will complete a 2:1 share split effective March 14, 2023.
Unlike a typical S&P 500 or any other broad large-cap ETF that is heavily weighted towards technology, IVOO has a smaller 10.2% weighting towards technology stocks. The sector with the largest exposure within IVOO is Financials (21.75% exposure).
Comparative ETF Analysis
In the mid-cap universe investors are offered many ETF choices for gaining diversified exposure. While many growth and value-oriented mid-cap ETFs are also available in this segment I will run a historical risk and return performance comparison between a few of the most popular blend mid-cap ETFs in the market. Comparison data relative to the S&P 500, represented by the Vanguard S&P 500 ETF (VOO) will also be provided. The group of Value ETFs includes IVOO, iShares Core S&P Mid-Cap ETF (IJH), Vanguard’s Mid-Cap Index ETF (VO) and iShares Russell Mid-Cap ETF (IWR). For the purposes of the analysis provided below, dividend reinvesting is assumed for all ETFs. The analysis dates back to 2010.
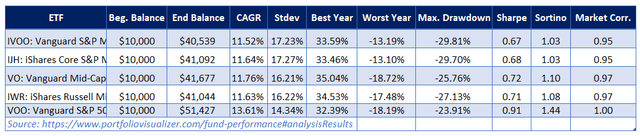
While all mid-cap ETFs have recorded strong, low double-digit performance over the 13+ year reference period, none has been able to match the S&P 500’s performance in a period of poor size factor returns, as explained earlier. Within the group of mid-caps, IVOO actually records the lowest annualized returns at an 11.52% CAGR. IVOO also records the second-highest volatility (17.23% standard deviation) among its peers.
Portfolio Visualizer
As the Sharpe and Sortino ratios of 0.67 and 1.03 also lead us to believe, IVOO offers less attractive risk-adjusted returns, especially compared to other mid-cap funds. Especially i9na case where mid-caps recover a performance edge due to a size factor realignment, ETFs like VO or IWR are likely to offer better performance attributes going forward.
Final Thoughts
After all things are considered, mid-caps are likely in a relatively advantageous position going forward. That said, IVOO is a comparatively less efficient and attractive ETF compared to an array of peers, even though its risk and return performance is still respectable.
Read the full article here


")

")
")

")
")