O stock’s recent acquisitions
The thesis of this article is to argue how recent acquisition activity by Realty Income Corporation (NYSE:O) is a double-edged sword. While boosting its portfolio and further growth potential, they also add quite a bit of uncertainty to shareholder returns, in my view.
Realty recently completed its merger with industry peer Spirit Realty Capital, Inc. Under the terms of the deal, which closed in January this year, Spirit holders received 0.762 of a share of Realty Income common stock, for a total enterprise value of $9.3 billion. Besides Spirit Realty Capital, the company has also made other sizable acquisitions in recent years. Another notable example was the VEREIT acquisition in late 2021. At that time, Realty acquired commercial property owner VEREIT for $11 billion, with that deal also paid for through the issuance of common stock. On one side, the addition of VEREIT and Spirit enhances the size and scale of Realty Income’s portfolio and should make the company less reliant on retail properties. But, on the other side, Realty Income’s debt load has more than doubled as you can see from the chart below. These transactions have also resulted in significant shareholder dilution in tandem as seen.
Next, I will elaborate on the reasons why these recent developments have clouded my outlook for the company.
Seeking Alpha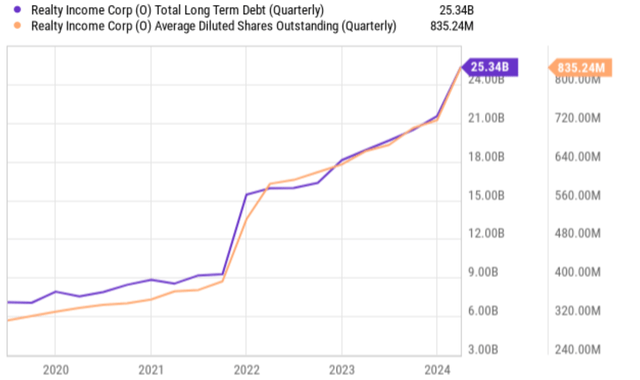
O stock: Stretched balance sheet and diluted share base
First, the substantially high debt load, combined with high borrowing rates, has materially stretched O’s balance sheet and will limit its future capital allocation flexibility (including dividend growth). The next chart was directly copied from O’s income statement and cash flow statement, showing the changes in its interest expenses and cash from operations (“CFO”) in recent years. As seen, its CFO has indeed increased significantly in recent years thanks to the acquisitions. In Dec 2021 before the VEREIT acquisition, its CFO was $1322 million. As for TTM, it grew to $3,006 million, translating into an increase of more than 130%. However, net interest expense has grown even more during this period. In December 2021, net interest expense was $326 million and it had grown to $817 million now, translating into an increase of 152%.
Note that I’m aware that FFO is a more traditional measure for REITs. FFO is similar to CFO but there are some differences. For example, FFO excludes the changes in working capital while CFO includes it. However, in the case of O, the changes in working capital (mainly accounts receivable and payable) are negligibly small as you can see from the cash flow statement below. Hence, the use of CFO here can make my point with sufficient accuracy.
Seeking Alpha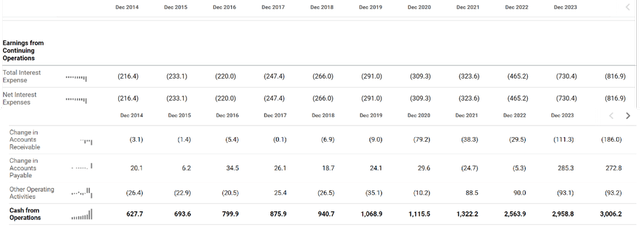
Other metrics, such as debt-to-equity ratio, also point to a more stretched balance sheet as you can see in the second chart below. To wit, the ratio was only around 0.3 in 2020, a very safe and conservative level. Despite the book value addition from recent acquisitions (Spirit came with a total book value of about $7.5 billion), its debt-to-equity ratio has risen sharply to the current level of 0.539x.
Besides the impact on its balance sheet and capital allocations, integrating large acquisitions can be complex and costly, potentially leading to short-term disruptions and higher operating expenses in the next few years to come. Moreover, efforts to make and integrate these large deals could also divert management’s attention from organic and potentially high-return opportunities. It’s crucial for investors to assess if management can effectively manage these acquisitions while maintaining its focus on core strengths and delivering value to shareholders over the long term.
Seeking Alpha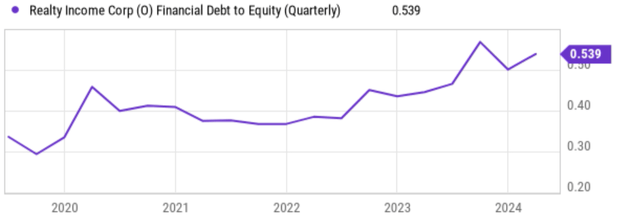
O stock: Valuation is not as attractive as on the surface
The stock seems to be attractively valued by the usual metrics such as P/cash ratio and dividend yield. More specifically, the chart below shows its price-to-CFO ratio compared to its historical average (top panel) and its dividend yield compared to its historical average (bottom panel). As seen, O’s current P/CFO ratio sits at 13x only, substantially lower than its historical average of 17.73x, suggesting a sizable valuation discount. Its dividend yield sends the same signal. As seen, O’s current dividend yield of 5.8% is slightly higher than its historical average of 4.63%.
Seeking Alpha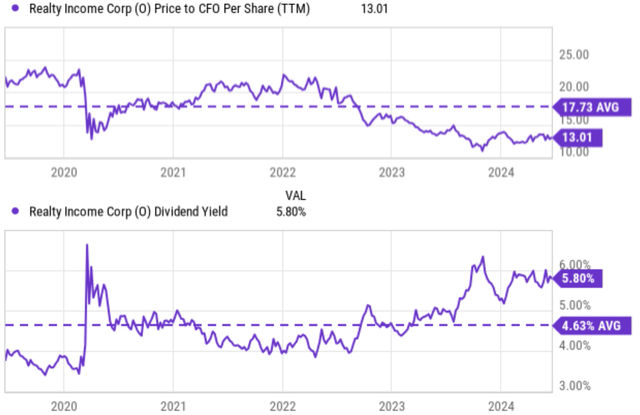
However, due to the drastic change in its debt burden in recent years, a leverage-adjusted valuation metric is more relevant in this case. For example, the next chart shows O’s EV/EBIT ratio compared to its historical average. The current EV/EBIT ratio is 42.57x, which shows no discount at all compared to its historical average of 44.02x (it’s actually a bit above the historical average). The EV/EBIT ratio sends a very different signal for its valuation than the P/CFO flow ratio simply because the EV/EBIT ratio takes a company’s debt into account, whereas the P/CFO ratio does not.
Seeking Alpha
Other risks and final thoughts
In terms of upside risks, O is one of the quintessential examples of a dividend growth stock. As a dividend champion, O provides investors with a good combination of dividend safety, dividend growth, dividend yield, and dividend consistency as you can see from the scorecard below. Furthermore, O is one of the few stocks that make monthly, rather than quarterly, payouts. Such strong dividend records stem from its stable business model. It places a large focus on acquiring single-tenant, necessity-based properties (some good examples are drug stores and grocery stores) leased under net lease agreements. This model shields O from many operational headaches as tenants are typically responsible for most property expenses and also help to maintain stable customer traffic even during economic downturns.
Seeking Alpha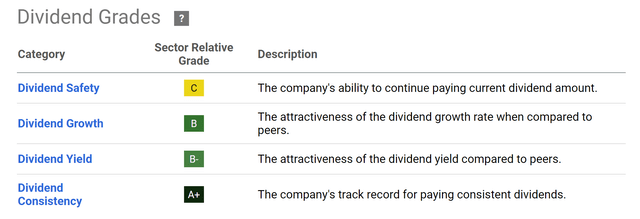
In terms of downside risks, the stretched balance sheet and the uncertainties created by its recent large acquisitions are the main ones on my list. Besides these specific risks, O and its REIT peers also share some common macroeconomic risks. As aforementioned, persisting high interest rates can strain both. High interest rates not only increase their borrowing costs but also tend to pressure the value of their existing properties. Additionally, a weakening economy could lead to higher vacancy rates across the commercial real estate market, impacting rental income for both O and its competitors. In the longer term, O could face some secular risks more specific to its business model. A key risk here is a shift in consumer habits away from brick-and-mortar retail and relying more and more on online shopping, which could negatively impact the tenants leasing O’s properties.
All told, recent developments at O have created a mixed picture in my eyes and led to my Hold rating. On the positive side, the stock offers an attractive combination of income, stability, and also a reasonable valuation. The company’s strong history of raising its dividends is made even more impressive in combination with its monthly payouts. I have no doubt that such a strong record will continue given the unique strength of its business model. However, on the negative O stock, I’m concerned about the stretched balance sheet and diluted share base. Moreover, for investors attracted to its attractive valuation measured by the price/cash ratio of dividend yield, my suggestion is to check out leverage-adjusted metrics too given the large increase in its debt level. These metrics suggest that valuation is not as attractive as it seems.
Read the full article here


