Q4 2025 Earnings Call Transcript")
")
Uranium has been touted as a clean renewable energy source that is more dependable than solar, wind or hydro.
Fundamentalists point towards a plethora of positive catalysts that are likely to lead to a resurgence in the uranium sector in the decades to come.
That said, price is king. Price action must be constructive before capital should be deployed into an investment. Uranium stocks, despite their huge fundamental potential, have been basing for 1.5 years, seeing a peak-to-trough of 40%. Letting capital sit idly there is an opportunity cost, even if one can stomach the volatility.
After a difficult and volatile 1.5 year period, I now think the uranium sector is ready to embark on its next wave higher.
Before I go through the technical charts, I will briefly go through the positive fundamentals surrounding the sector. There are analysts on the site who cover this area more extensively, so please do your own research.
Die-hard bulls will point towards uranium’s energy efficiency – for example, the energy generated by the fission of a single uranium pellet is equivalent to:
- 1 ton of coal or
- 120 gallons of crude oil or
- 17,000 ft3 of natural gas
Countries are also starting to invest in nuclear reactors, as well as stock up on uranium supplies. China is embarking on an ambitious programme and is expected to have the highest capacity globally by 2030.
By 2035, nuclear power is further expected to account for 10 percent of China’s total power generation. For this to be achieved, six to eight new nuclear power plants are expected to be approved every year from 2021 to 2025. The country now has 17 plants under construction.
Right now, the technical charts are starting to show confluence with the bullish fundamental case for the sector.
Uranium spot price for one, has been stealthily rising higher since 2021, despite uranium stocks undergoing a torrid, volatile time during the same period. Eventually, higher raw material prices should lift the prices of uranium miners.
Weekly Chart: Uranium Spot Price
TradingView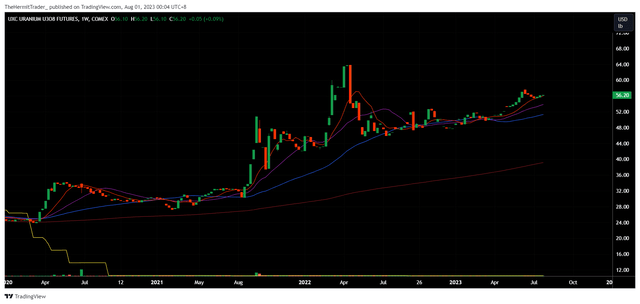
Looking at the uranium miner ETF (URNM) (NYSEARCA:URA) – both provide exposure to the sector with minor differences in the stock composition and weightage, URA has broken above multi-month downtrend resistance on the weekly chart. Price came back to retest the breakout zone in July, and bounced higher.
Weekly Chart: URA
TradingView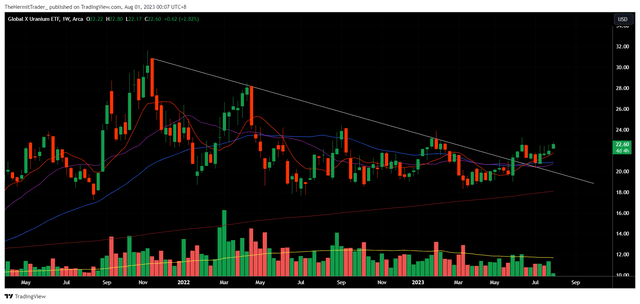
Drilling down to the daily chart, URA has pushed above a tight 2.5 week range. This means that both the longer time frame (weekly chart) and lower time frame (daily chart) are now showing that the path of least resistance for the sector is higher.
Daily Chart: URA
TradingView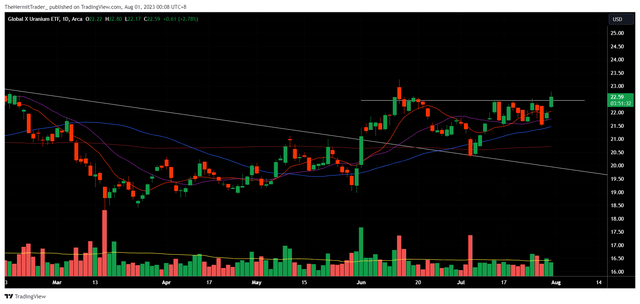
Cameco Corp (CCJ), which is one of the largest cap uranium miners in the sector, has already gone on to make new 52-week highs. This stock is leading the sector higher.
Weekly Chart: CCJ
TradingView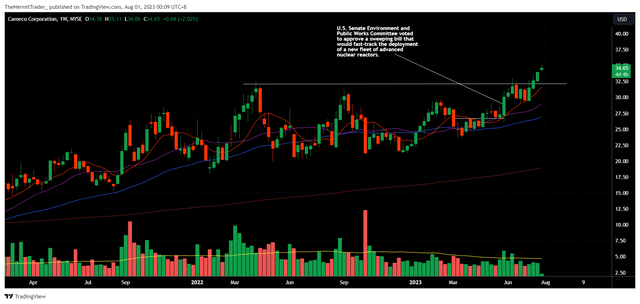
In terms of upside potential, going back to the chart of URA, we may observe from the monthly chart that prices cratered back in 2011 due to the Fukushima reactor accident, that sapped a lot of interest from the sector. Between 2015 to 2021, URA actually built a big base and broke out from it. We may now be looking at a continuation move higher.
Monthly Chart: URA
TradingView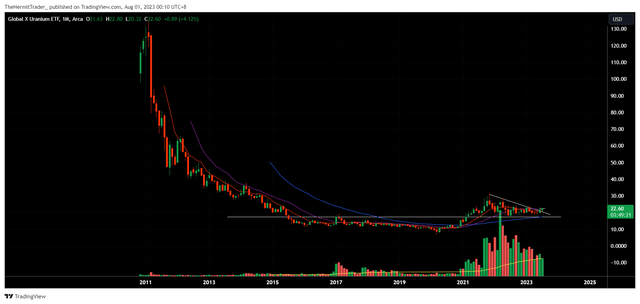
For those who want to get exposure to the sector without having to choose individual stocks to invest in, the URA ETF would be an ideal vehicle. Individual miners may issue shares to raise capital, so investing in an ETF mitigates that risk.
These are the top holdings for URA. As we may observe, the ETF also invests in spot uranium, which is the item on the second row.
Globalxetfs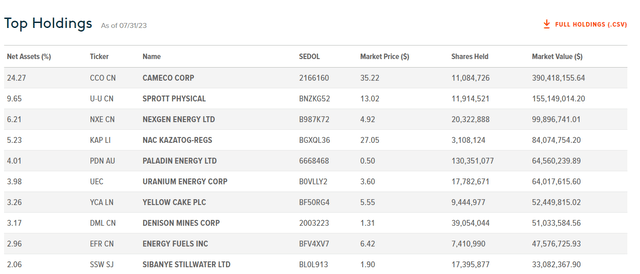
There is also sufficient liquidity for the ETF. Average daily volume is above 1 million shares, and total AUM stands at $1.6 billion. Do note that URA’s dividend yield is negligible, so this is not an income play, rather a play on capital appreciation.
ETFdb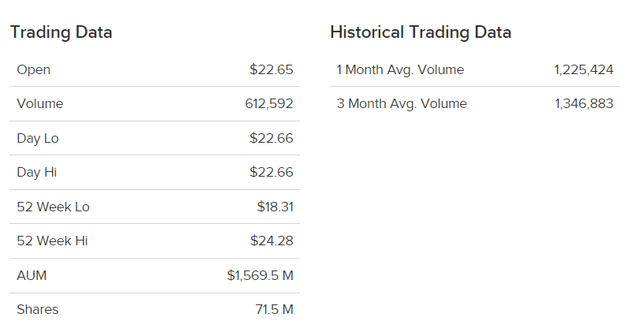
URA is still trading -70% below its inception NAV, and more than 80% below its all-time highs, as we may observe from the performance chart below. There is potential for uranium stocks to make a comeback, especially if we are seeing a fundamental shift in countries towards nuclear energy.
Globalxetfs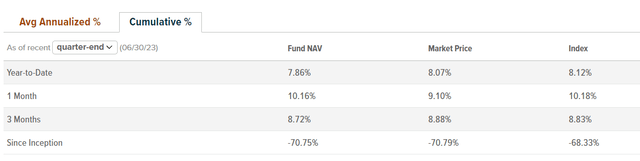
Year to date, URA is up close to 8%, lagging the S&P 500’s return of 19%. That is largely attributed to the outperformance in mega-cap technology stocks, or FAANG stocks (FNGU). If this bull market has legs, market breadth is expected to improve, and other sectors like uranium may participate in the upside.
More importantly, the timing looks ripe on the charts, as we have seen uranium stocks break out from a multi-year base back in 2021. The past 1.5 years could be the consolidation phase, and the sector may now be gearing up for its next leg higher.
Read the full article here

 Q4 2025 Earnings Call Transcript")

")