")
Investment Thesis
Picking one sector to outperform is challenging. However, large-cap Industrial stocks, represented by the Industrial Select Sector SPDR ETF (NYSEARCA:XLI), look promising on paper, offering a relatively attractive 22.42x forward earnings valuation and 11.20% estimated earnings per share growth. In addition, XLI constituents delivered a solid earnings surprise this quarter, led by top-holding Caterpillar (CAT), whose shares hit a record high last Tuesday. Though XLI faces macroeconomic challenges impacting most U.S. stocks, I feel good about the sector and plan to initiate a position in XLI this week.
XLI Overview
Fund Composition
XLI tracks the Industrial Select Sector Index, seeking to provide an effective representation of large-cap Industrial stocks in the S&P 500 Index. Current industry allocations are as follows:
- Aerospace & Defense: 18.93%
- Industrial Machinery & Supplies: 10.36%
- Industrial Conglomerates: 9.63%
- Rail Transportation: 8.09%
- Construction Machinery & Heavy Transportation Equipment: 7.64%
- Air Freight & Logistics: 6.96%
- Electrical Components & Equipment: 6.84%
- Human Resource & Employment Services: 5.50%
- Building Products: 5.31%
- Agricultural & Farm Machinery: 3.57%
- Environmental & Facilities Services: 3.11%
- Trading Companies & Distributors: 3.02%
- Research & Consulting Services: 2.72%
- Diversified Support Services: 2.54%
- Passenger Airlines: 2.53%
- Cargo Ground Transportation: 1.70%
- Construction & Engineering: 0.92%
- Data Processing & Outsourced Services: 0.61%
These 18 industries make XLI one of the better-diversified sector ETFs. It’s unlikely you could replicate this, so XLI’s 0.10% expense ratio is a reasonable price for tax-efficient exposure to the sector. It’s also well-diversified at the company level, with just 38.85% of holdings in the top ten.
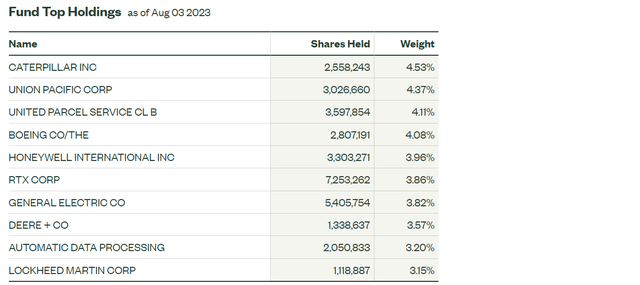
State Street
As mentioned, Caterpillar is the leading stock, with Union Pacific (UNP), United Parcel Service (UPS), and Boeing (BA) not far behind. These stocks are also prominent in the Vanguard Industrials ETF (VIS), though at lower allocations. VIS adds small- and mid-cap stocks, while XLI only includes large caps.
Performance Analysis
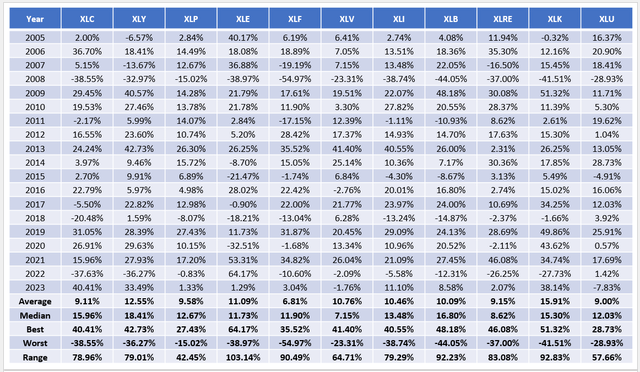
State Street’s Select Sector ETFs launched on December 16, 1998, except for Communication Services (XLC), which launched on June 18, 2018, and Real Estate (XLRE), which launched on October 7, 2015. However, I’ve backfilled XLC’s results with Vanguard’s VOX and XLRE’s with Vanguard’s VNQ for the following analysis. This additional data allowed me to rank each sector yearly from 2005-2023.
The Sunday Investor
I want to highlight how XLI’s best and worst returns of 40.55% and -38.74% are average. The difference (range) is 79.29% and indicates XLI is far less risky than Energy (103.14%) and Technology (92.83%), while Consumer Staples (42.45%) and Utilities (57.66%) offer the most stable annual returns. It’s evident to many, but it’s also well-supported by long-term data.
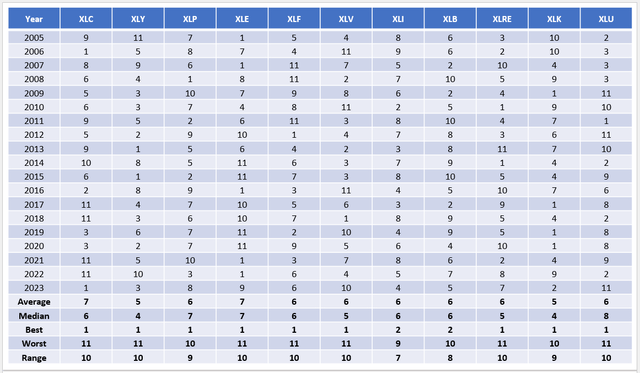
The next table takes the data from above and ranks each sector from best (#1) to worst (#11). Here, we learn that XLI was never the worst-performing sector ETF. Also, its average and median ranking was #6, which is the midpoint of the range, so I don’t feel XLI is unnecessarily risky. In contrast, XLE, XLF, and XLRE have demonstrated an ability to rank the best or the worst in any given year. Even defensive sectors like Health Care and Utilities rank #10 and #11 this year after a solid 2022, so anything can happen. Meanwhile, Industrials have a relatively consistent track record.
The Sunday Investor
This consistency is evident in XLI’s performance since January 1999 vs. the SPDR S&P 500 ETF (SPY). Annualized gains were 8.11% vs. 7.29%, which offset a higher standard deviation figure. The 57.16% maximum drawdown noted below occurred between October 2007 and February 2009, and although it was 6.36% worse than SPY’s drawdown, XLI recovered by April 2011. SPY took an additional 11 months.

Portfolio Visualizer
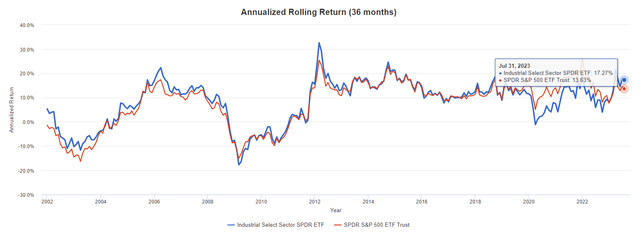
Finally, consider the three-year rolling returns chart that shows XLI beating SPY by an annualized 3.64% (17.27% vs. 13.63%) for the period ending July 2023. XLI has come back strong since March 2020, when it lagged by 6.22%. Like any ETF, it has its ups and downs, but the U.S. needs a strong Industrial sector. That’s why XLI tracks the broader market better than most and why it’s unlikely to be a poor long-term holding.
Portfolio Visualizer
Instead, the question is one of valuation, growth potential, and investing alongside solid earnings momentum, which XLI has. Before examining how XLI’s fundamentals compare with SPY, I want to summarize the quarterly earnings results for XLI’s holdings.
XLI Analysis
Q2 Earnings Season Results
According to Yardeni Research, the Large Cap Industrial Sector delivered a 7.8% aggregate earnings surprise this quarter as of August 2, 2023, slightly edging out the S&P 500 Index’s 7.2%. With 78.7% of companies reported, the Industrial sector experienced 17.3% earnings growth, and 74.6% reported a positive earnings surprise. Therefore, the sector is not only growing, but is beating analyst expectations. Typically, analysts then increase their earnings and price targets, and in some cases, it paves the way for price-multiple expansion.
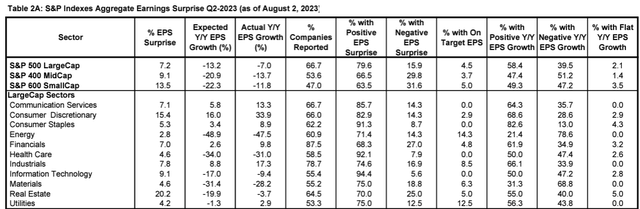
Yardeni Research
On a weighted average basis, XLI trades at 22.42x forward earnings, compared to 26.46x for SPY. This discounted valuation, coupled with solid earnings growth and earnings momentum, is an attractive selling point. While it’s true that XLI’s P/E has expanded recently, the gap with SPY grew from 1.70 points in February to 4.04 points today.
Since August 2, four more companies have reported quarterly results. I’ve linked them below with their sales and earnings surprise figures.
- Parker-Hannifin (PH): 1.73% sales beat, 10.77% earnings beat
- Cummins (CMI): 2.94% sales beat, 0.80% earnings miss
- Quanta Services (PWR): 7.20% sales beat, 0.61% earnings beat
- Huntington Ingalls Industries (HII): 4.27% sales beat, 4.45% earnings beat
The weighted average sales and earnings surprises for the 64/75 companies that reported since July 1, 2023, were 2.21% and 6.80%. Of the remaining 339/425 non-Industrial stocks in the S&P 500 Index, the figures were 1.07% and 7.84%. In short, Industrial stocks delivered strong sales beats where historically, the average surprise is about 1-2% for the broader market. Industrial stocks are slightly lagging on earnings surprises, where the long-term average is about 5-7%. On balance, the sector outperformed.
XLI Fundamentals By Company
The following table highlights selected fundamental metrics for XLI’s top 25 holdings, totaling 65.62%. Again, this is good diversification for a sector ETF. Among the ten ETFs mentioned earlier, the Financial Select Sector SPDR ETF (XLF) is the closest, with 78.12% allocated to its top 25 holdings.
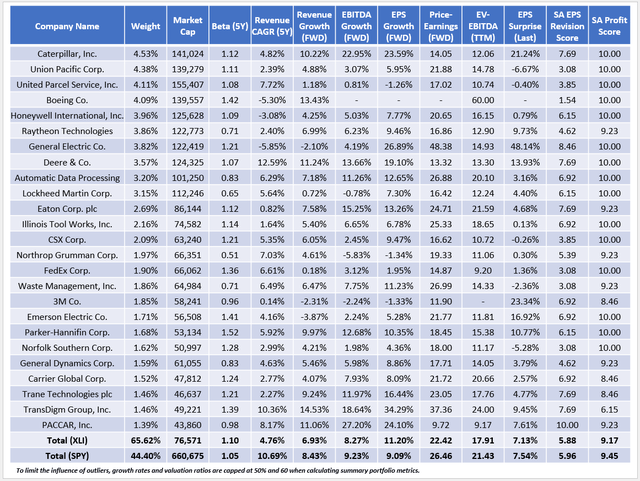
The Sunday Investor
The higher 1.10 five-year beta is consistent with the higher standard deviation in the earlier Portfolio Visualizer chart. XLI is more volatile. However, the chances of it underperforming the market substantially are small, and the discounted valuation is an excellent safety margin. Quarterly earnings results provided by Yardeni indicated XLI is a growing sector, and this table confirms how analysts expect more of the same moving forward. XLI’s constituents are expected to grow earnings per share by 11.20% compared to 9.09% for SPY, with sales and EBITDA growth lagging by 1-2%. Still, earnings surprise and revision figures are similar, and XLI’s 9.17/10 Profit Score indicates a high-quality fund. There are more conservative funds like XLU. However, the downside is lower profitability, and investors should demand a more considerable discount.
Investment Recommendation
XLI is a moderately risky play with superior fundamentals compared to SPY. I’ve rated it a “buy” because it trades at a 4.02-point discount on forward earnings, has strong earnings potential, and recently delivered relatively strong results this earnings season. XLI’s historical returns give me added confidence, and the fact that it’s performed about average in the three down years since 2005 (2006, 2015, 2022) indicates it’s not a particularly risky call.
Read the full article here

")
")
 Analyst/Investor Day Transcript")

")