Copper prices sunk to their lowest level in almost two months as the holiday-shortened week got underway on June 17. The global growth trade has recently been called into question among volatile price reactions to elections (see: Mexico, India, France).
What’s more, the US Dollar Index has notched multi-week highs amid a falling interest rate environment. It appears investors’ concerns have shifted from inflation to growth, nearly on a dime.
I am downgrading the SPDR S&P Metals & Mining ETF (NYSEARCA:XME) from a buy to a hold. Shares rallied substantially from my previous analysis in the summer of 2023, nearly hitting a fresh high above the Q2 2022 peak of $66.63.
Back then, my thesis was that global growth optimism and improved momentum among metals would support a rally among inexpensive metals and mining equities, and that largely played out, particularly through last March.
Prompt-Month Copper Futures: Lowest Since April 23
TradingView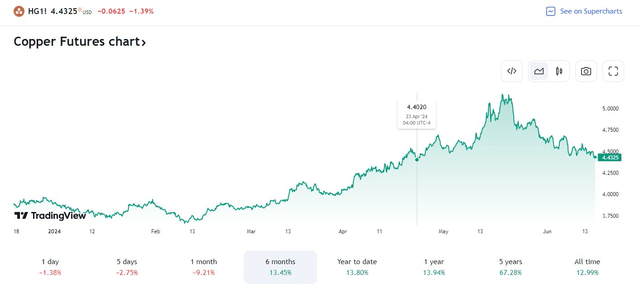
XME’s Relative Strength Drops to 1-Year Lows
Stockcharts.com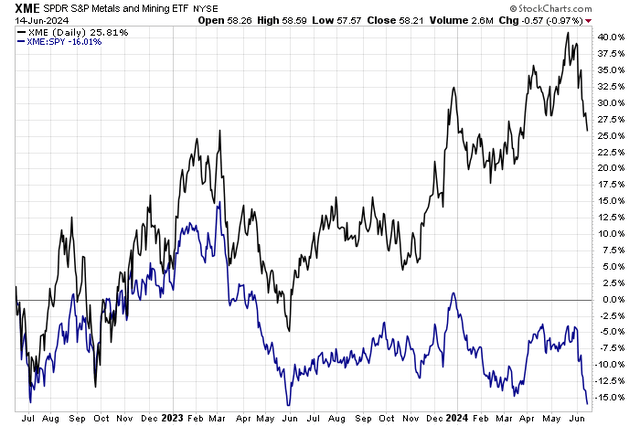
US Dollar Index: Highest Since April 30
TradingView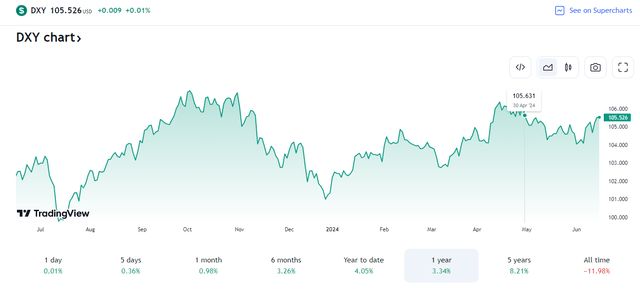
According to the issuer, XME offers investors exposure to the metals & mining segment of the S&P Total Market Index, which comprises the following sub-industries: Aluminum, Coal & Consumable Fuels, Copper, Diversified Metals & Mining, Gold, Precious Metals & Minerals, Silver, and Steel. Unlike many other ETFs, XME uses an equal weight methodology. This means that smaller companies can have an outsized impact on performance compared to a traditional cap-weighted index.
XME, which has exposure to steel stocks, has grown in size and market value since I last analyzed it. Total assets under management are now $2.0 billion, up from $1.8 billion last summer, while the ETF’s annual expense ratio is modest at just 0.35%. XME’s yield is also low – just 0.91% over the past 12 months, so this is not a popular choice among income-focused investors.
But share-price momentum has been decent for much of the last year, despite bouts of volatility – evidenced by its weak D- Risk ETF Grade by Seeking Alpha Quant. Finally, liquidity metrics are favorable; average daily volume exceeds three million shares over the past 90 days, while the fund’s 30-day median bid/ask spread is only two basis points.
Looking closer at what’s inside XME, the 3-star, Silver-rated ETF by Morningstar is risky in the sense that there’s very high exposure to small-cap stocks. There’s just a 5% weight to large caps. The upside here is that small caps are quite cheap today following the last two years’ rise in interest rates, but as sentiment pivots from inflation fears to growth fears, it could be ‘heads I win, tails you lose’ for small caps for the balance of the year. Still, there is diversification between the value and growth styles with XME today.
The fund has turned more expensive on a price-to-earnings ratio basis. A year ago, it had a P/E under 10. Today that figure is above 18 while its long-term earnings growth rate is still robust, above 13%. So, it’s no longer a great buy on valuation, but the PEG ratio is reasonable. If we assign an earnings multiple closer to that of the total global stock market and near the S&P 500 equal weight index, then we are talking about a 17x P/E. So, XME is not extremely overvalued, but it’s no longer cheap in my view.
XME: Portfolio & Factor Profiles
Morningstar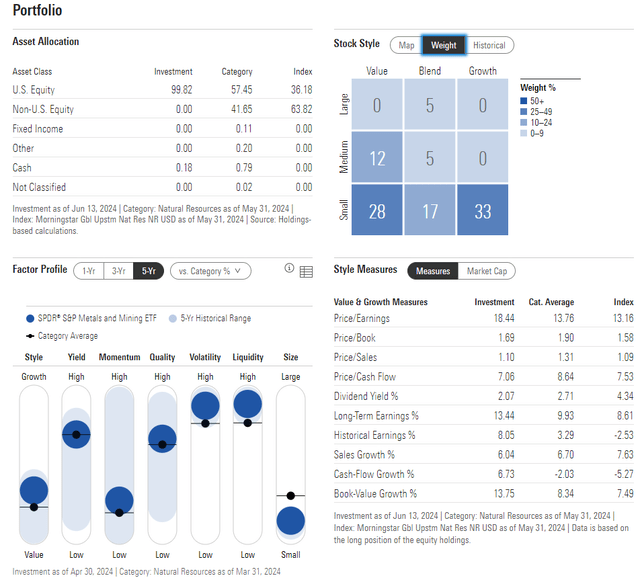
XME is focused on the Materials sector, with nearly three-quarters of the allocation in that highly cyclical segment of the stock market. The top 10 holdings account for about half of the portfolio, so that is somewhat concentrated. Energy and Industrials, two more areas that have sharply underperformed the S&P 500 in the past two months, round out the fund’s positions.
XME: Holdings & Dividend Information
Seeking Alpha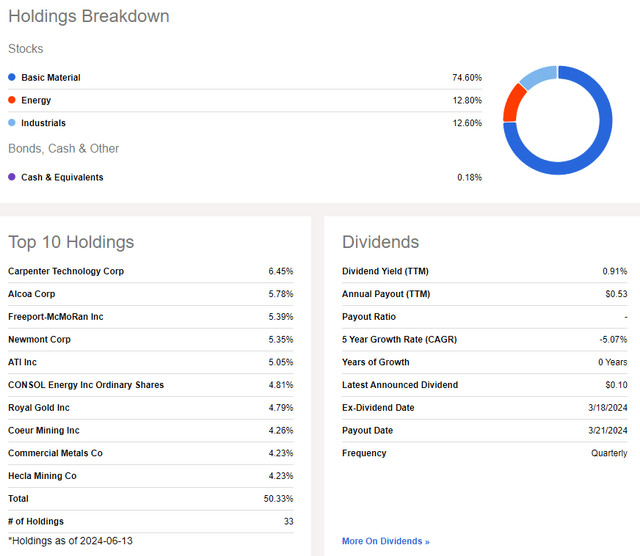
What’s encouraging, though, is that June and July tend to be strong months for XME before bullish seasonal trends run out during the back half of summer, at least according to the last 10 years of performance history.
XME: Bullish June-July Trends, Weaker in August-September
Seeking Alpha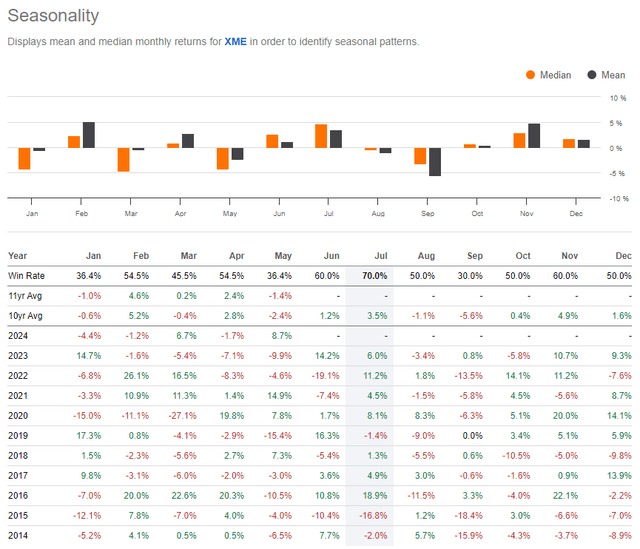
The Technical Take
After finding long-term support around the $40 mark in late 2021 through October 2022, XME began to trend higher through the early part of this year. Notice in the chart below that an impressive rally lasted nearly two years, peaking right at its 2022 high. Sellers emerged at the previous peak, and recent price action has been weak. XME broke down under an uptrend support line earlier this month, and the rising 200-day moving average comes into play near $56.60.
Now with its worst RSI momentum reading going back to June 2023, the bears have certainly reasserted their control over the ETF’s trend. But with a high amount of volume by price in the mid-$50s, we could see some support further along in this correction. Furthermore, I spotted a price gap near the $50 mark which could eventually get filled – that’s another area to monitor technically.
Overall, XME’s uptrend has been broken, and I see more volatility ahead as we approach the second half.
XME: Shares Pause At Long-Term Resistance, Break A Near-Term Uptrend
Stockcharts.com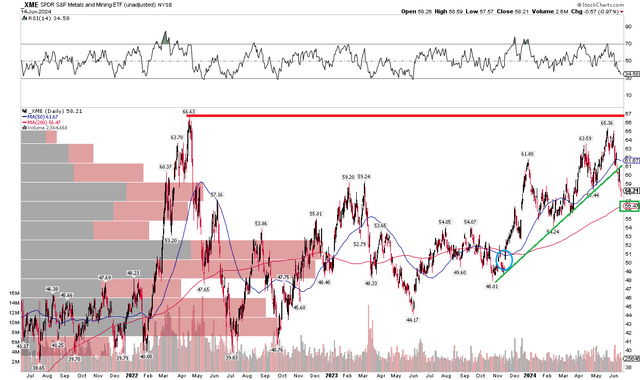
The Bottom Line
I have a hold rating on XME. I see this cyclical-value fund as more expensive than it was a year ago, while momentum signals suggest risk management is prudent during the months ahead.
Read the full article here


