Earnings of 1st Source Corporation (NASDAQ:SRCE) will likely receive support from below-average loan growth through the end of 2025. On the other hand, upcoming interest rate cuts will have an overall slightly negative impact on the net interest margin, which will constrain earnings growth next year. Overall, I’m expecting the company to report earnings of $5.37 per share for 2024, up 7%, and $5.44 per share for 2025, up by just 1% year-over-year. The December 2024 target price suggests a mid-single-digit downside from the current market price. Based on the total expected return, I’m adopting a hold rating on 1st Source Corporation.
Loan Growth Likely to Remain Below Average
1st Source Corporation’s loan growth improved in the second quarter from the first quarter of 2024, but it was still not at par with last year’s growth rate. The loan book has grown by 4.1% annualized in the first half of the year, which is below the last five-year compounded annual growth rate of 6.2%.
1st Source focuses on equipment financing, especially the financing of trucks, aircraft, and construction equipment. The equipment finance segment makes up 53% of total loans. The rest of the loans are in the community banking segment, most of which are to small local businesses. Given the loan portfolio characteristics, the Purchasing Managers Index (“PMI”) is an important indicator of the demand for SRCE’s credit products. The manufacturing PMI shows that the manufacturing industries have been depressed since late last year. Further, the manufacturing PMI is much worse now compared to previous years. The services PMI is doing better, but it is also just barely in the expansionary territory (above 50).
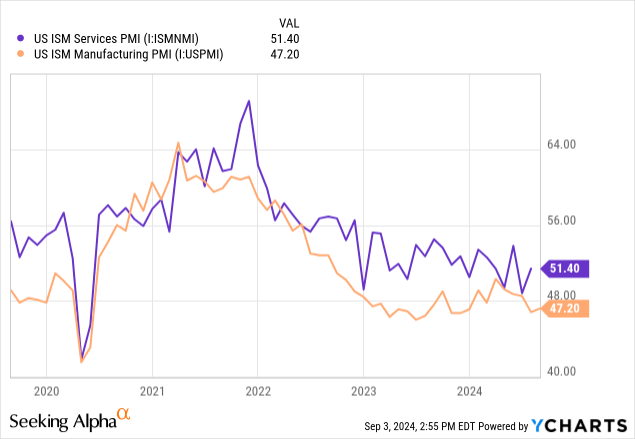
As a result, I’m anticipating the equipment finance division to perform worse than in previous years in the short term. I’m anticipating the community banking segment to perform better, especially because interest rate cuts should whet the credit appetite of retail customers.
Overall, I’m expecting the loan portfolio to grow by 1.25% every quarter through the end of 2025, or 5.1% annualized. My projection is below the historical 5-year CAGR. Further, I’m expecting deposits to grow mostly in line with loans. The following table shows my balance sheet estimates.
| Financial Position | FY19 | FY20 | FY21 | FY22 | FY23 | FY24E | FY25E |
| Net Loans | 4,974 | 5,349 | 5,219 | 5,872 | 6,371 | 6,667 | 7,006 |
| Growth of Net Loans | 5.1% | 7.5% | (2.4)% | 12.5% | 8.5% | 4.6% | 5.1% |
| Other Earning Assets | 1,105 | 1,394 | 2,374 | 1,842 | 1,701 | 1,765 | 1,837 |
| Deposits | 5,357 | 5,946 | 6,679 | 6,928 | 7,039 | 7,377 | 7,753 |
| Borrowings and Sub-Debt | 276 | 291 | 330 | 321 | 419 | 394 | 410 |
| Common equity | 828 | 887 | 916 | 864 | 990 | 1,092 | 1,190 |
| Book Value Per Share ($) | 32.4 | 34.7 | 37.0 | 35.0 | 40.5 | 44.6 | 48.6 |
| Tangible BVPS ($) | 29.1 | 31.5 | 33.6 | 31.6 | 37.1 | 41.1 | 45.1 |
Source: SEC Filings, Author’s Estimates (In USD million unless otherwise specified)
Margin to be Rangebound
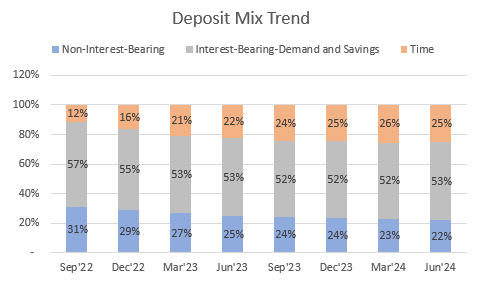
1st Source Corporation’s net interest margin continued to improve in the second quarter of 2024. The margin grew by 5 basis points during the second quarter, after it had increased by 3 basis points in the first quarter and 6 basis points in 2023. This improvement has come despite the worsening of the deposit mix which pushed up the funding costs. The upcoming interest rate cuts should stem the migration of deposits from non-interest-bearing accounts to high-rate accounts, as they will reduce the relative attraction of high-rate accounts. The slowing down of deposit migration will reduce the fueling of deposit costs, which will in turn ease the pressure on the margin.
SEC Filings
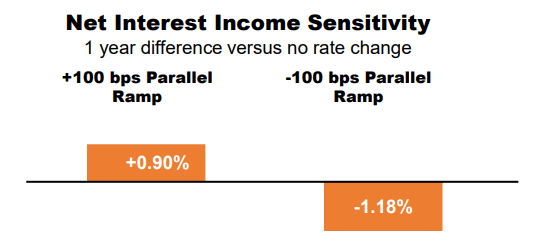
On the other hand, the upcoming interest rate cuts will have a direct negative impact on the net interest margin in the short term. This is because the deposit cost has limited downside as the deposit book is heavy on low-rate accounts, namely interest-bearing demand (35% of total deposits), savings (17% of total deposits), and non-interest-bearing accounts (22% of total deposits). Meanwhile, loan yields have plenty of room to decline. The average loan yield is 6.89%, and variable-rate loans make up 38% of total loans. The results of the management’s rate-sensitivity analysis given in the earnings presentation show that a 100-basis points rate cut could reduce the net interest income by 1.18%.
2Q 2024 Earnings Presentation
While the deposit mix improvement will lift the margin, the interest rate cuts will pressurize the margin. As a result, I’m expecting the margin to change very little over the next year and a half. I’m expecting the margin to remain unchanged in the second half of 2024, and dip by six basis points in 2025.
Expecting Earnings of Around $5.37 for 2024
The below-average loan growth will likely propel earnings in the next year and a half. On the flip side, the net interest margin will likely constrain earnings growth next year. Apart from the outlook on the balance sheet and net interest margin, I’m making the following assumptions.
- I’m expecting the provision-expense-to-total-loan ratio to revert to the five-year average of 0.25% after an unusual dip in the second quarter.
- I’m anticipating the non-interest income to remain unchanged from the second quarter’s level. The non-interest income has declined in most of the last five years; however, I’m positive about the outlook because interest rate cuts should improve the gains on sales of mortgage loans.
- I’m expecting the efficiency ratio to remain rangebound near the first half’s level of 52%.
Considering these factors, I’m estimating earnings of $5.37 per share for 2024, up 7% year-over-year, and $5.44 per share for 2025, up 1% year-over-year. The following table shows my income statement estimates.
| Income Statement | FY19 | FY20 | FY21 | FY22 | FY23 | FY24E | FY25E |
| Net interest income | 224 | 226 | 237 | 263 | 279 | 298 | 312 |
| Provision for loan losses | 16 | 36 | (4) | 13 | 6 | 15 | 18 |
| Non-interest income | 101 | 104 | 100 | 91 | 91 | 92 | 93 |
| Non-interest expense | 189 | 187 | 186 | 185 | 202 | 203 | 213 |
| Net income – Common Sh. | 92 | 81 | 118 | 120 | 124 | 131 | 133 |
| EPS – Diluted ($) | 3.57 | 3.17 | 4.70 | 4.84 | 5.03 | 5.37 | 5.44 |
Source: SEC Filings, Author’s Estimates (In USD million unless otherwise specified)
Risks Seem to be Low
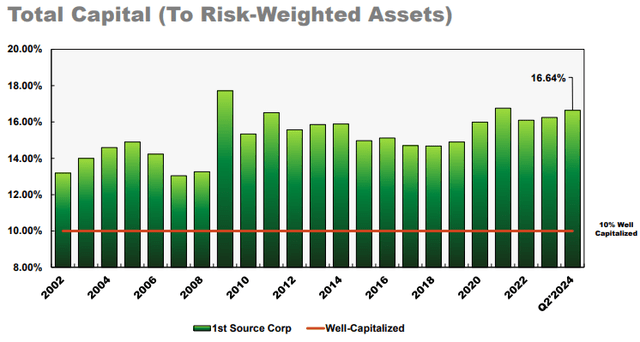
1st Source Corporation’s capital position is impeccable, which is why I think the company’s riskiness is very low. The company has consistently reported very high total capital ratios that are much higher than the minimum regulatory requirement of 10%.
2Q 2024 Earnings Presentation
The loan portfolio also carries very low credit risk. Non-performing assets are down to just 0.31% of total assets from 0.37% at the end of 2023 and 0.45% at the end of 2022, as mentioned in the earnings presentation. Moreover, unrealized losses on the Available-for-Sale securities portfolio totaled $138.7 million, which is just 13% of the total equity book value. I’m expecting most of these losses to start reversing soon as interest rates decline.
Adopting a Hold Rating
1st Source Corporation is offering a dividend yield of 2.3% at the current quarterly dividend rate of $0.36 per share. The earnings and dividend estimates suggest a payout ratio of 26% for both 2024 and 2025, which is close to the five-year average of 29%. Therefore, I’m not expecting an increase in the dividend level any time soon.
I’m using the historical price-to-tangible book (“P/TB”) and price-to-earnings (“P/E”) multiples to value 1st Source Corporation. The stock has traded at an average P/TB ratio of 1.39x in the past, as shown below.
| FY19 | FY20 | FY21 | FY22 | FY23 | Average | |
| T. Book Value per Share ($) | 29.1 | 31.5 | 33.6 | 31.6 | 37.1 | |
| Average Market Price ($) | 46.7 | 36.6 | 46.7 | 49.1 | 46.1 | |
| Historical P/TB | 1.61x | 1.16x | 1.39x | 1.55x | 1.24x | 1.39x |
Source: Company Financials, Yahoo Finance, Author’s Estimates
Multiplying the average P/TB multiple with the forecast tangible book value per share of $41.1 gives a target price of $57.2 for the end of 2024. This price target implies a 6.9% downside from the August 30 closing price. The following table shows the sensitivity of the target price to the P/TB ratio.
| P/TB Multiple | 1.19x | 1.29x | 1.39x | 1.49x | 1.59x |
| TBVPS – Dec 2024 ($) | 41.1 | 41.1 | 41.1 | 41.1 | 41.1 |
| Target Price ($) | 49.0 | 53.1 | 57.2 | 61.4 | 65.5 |
| Market Price ($) | 61.5 | 61.5 | 61.5 | 61.5 | 61.5 |
| Upside/(Downside) | (20.2)% | (13.6)% | (6.9)% | (0.2)% | 6.5% |
Source: Author’s Estimates
The stock has traded at an average P/E ratio of around 10.8x in the past, as shown below.
| FY19 | FY20 | FY21 | FY22 | FY23 | Average | |
| Earnings per Share ($) | 3.6 | 3.2 | 4.7 | 4.8 | 5.0 | |
| Average Market Price ($) | 46.7 | 36.6 | 46.7 | 49.1 | 46.1 | |
| Historical P/E | 13.1x | 11.5x | 9.9x | 10.1x | 9.2x | 10.8x |
Source: Company Financials, Yahoo Finance, Author’s Estimates
Multiplying the average P/E multiple with the forecast earnings per share of $5.37 gives a target price of $57.9 for the end of 2024. This price target implies a 5.9% downside from the August 30 closing price. The following table shows the sensitivity of the target price to the P/E ratio.
| P/E Multiple | 8.8x | 9.8x | 10.8x | 11.8x | 12.8x |
| EPS 2024 ($) | 5.37 | 5.37 | 5.37 | 5.37 | 5.37 |
| Target Price ($) | 47.1 | 52.5 | 57.9 | 63.2 | 68.6 |
| Market Price ($) | 61.5 | 61.5 | 61.5 | 61.5 | 61.5 |
| Upside/(Downside) | (23.3)% | (14.6)% | (5.9)% | 2.9% | 11.6% |
Source: Author’s Estimates
Equally weighting the target prices from the two valuation methods gives a combined target price of $57.5, which implies a 6.4% downside from the current market price. Adding the forward dividend yield gives a total expected return of negative 4.2%.
In my last report, which was issued back in July 2023, I adopted a hold rating on the company. Based on my updated total expected return, I’m maintaining a hold rating on 1st Source Corporation.
Read the full article here


